A place where economics, financial markets, and real estate intersect.
Showing posts with label new home sales. Show all posts

Wednesday, July 25, 2018

Morning Report: New Home Sales fall

Vital Statistics:

Last Change
S&P futures 2816 -4
Eurostoxx index 387.12 -1.06
Oil (WTI) 68.52 0
10 Year Government Bond Yield 2.94%
30 Year fixed rate mortgage 4.61%

Stocks are lower this morning after lousy earnings out of the automakers. Bonds and MBS are flat. 

Donald Trump tweeted contradictory statements about trade yesterday, both extolling the virtues of tariffs and also telling Europe that he is ready to end all tariffs if they are. He is also planning to use taxpayer money to help offset the negative effects of Chinese retaliatory tariffs on American farmers. This is New Deal type stuff and I have to imagine that Congress is contemplating legislation to take control of tariffs back from the Executive Branch. When tariffs were going down overall worldwide, it may have made sense to allow the President to lower them without involving the legislative branch, but the unintended consequence was that it allows the President to conduct a trade war unilaterally. 

New Home Sales fell 5% on a MOM basis, but were up 2% on a YOY basis to a seasonally-adjusted annual level of 631,000. The Street was looking for something around 680,000. New Home Sales is a notoriously volatile estimate so that number could be revised upward next month. For sale inventory came in at 301,000 which represents a 5.7 month supply. 

Mortgage Applications fell 0.2% last week as purchases fell 1% and refis rose 1%. 

Flagstar reported earnings yesterday. EPS and revenues rose, however there are some acquisition-related effects happening (not Stearns though). Mortgage origination volume fell by 1.5% and gain on sale fell by 6 basis points. Flagstar appears to be taking share, at least judging by those numbers. Most other banks are reporting sizeable volume drops. 

With home prices back above peak bubble levels, the question of affordability invariably comes up. CoreLogic crunched the numbers and it turns out that if you adjust for inflation, the median mortgage payment (P&I) on the median house is much lower than the peak years. This is being driven by the drop in rates. Of the top 10 MSAs, only San Francisco and Denver were higher than the peak. Compared to pre-bubble years (2002), they are higher. 


Redfin notes that some of the least affordable MSAs are starting to see an increase in inventory. Homes for sale rose 35% in Portland, 12% in San Jose, and 24% in Seattle. Whether that inventory buildup remains enough to slow the double-digit home price appreciation in those markets remains to be seen. We are heading into the seasonally slow period, and as a general rule home prices decline in Fall and Winter. Overall, home prices rose 5.7% which is the smallest increase since late 2016. Inventory levels still declined on a YOY basis. 

Chinese investors were net sellers of US commercial property in the second quarter for the first time in a decade. Pressure from Beijing is the catalyst, although China has a real estate bubble of their own to deal with. Chinese money was also behind some of the activity in the big West Coast MSAs, and it will be interesting to see if that dumps some supply on the market to balance it out. 

Monday, June 25, 2018

Morning Report: New Home Sales jump

Vital Statistics:

Last Change
S&P futures 2745 -14.5
Eurostoxx index 379.79 -5.22
Oil (WTI) 69.07 0.49
10 Year Government Bond Yield 2.89%
30 Year fixed rate mortgage 4.57%

Stocks are lower this morning on continued trade tensions. Bonds and MBS are up

Economic activity decelerated in May, according to the Chicago Fed National Activity Index. Production-related indicators were a drag on the index (probably an effect of trade issues) while employment-related indicators had a positive impact once again. This index is a meta-index of 85 different sub-indices, and while it is backward-looking and generally not market moving, it provides a good global snapshot of the economy. 

The trade war is beginning to have some real economic effects as the CFNAI indicated. While it is primarily limited to steel, many companies that use it as an input are raising prices, which is going to have a few negative effects on the economy - first firms that use steel and cannot pass on price increases are probably going to lay off workers, while the inflationary pressures from increased prices will keep the Fed raising interest rates. Retaliatory tariffs from our partners are causing US exporters to shift production overseas. Note that lumber tariffs are increasing the price of home construction, which is another drag on the economy. 

Given the recessionary potential of trade wars the shape of the yield curve is going to become a bigger talking point for the business press and will be watched closely by the Fed. The shape of the yield curve essentially means the difference between short term rates and long term rates. The most common description is the 2s-10s spread, which is about 34 basis points at the moment. When the yield curve is strongly upward sloping (in other words, the 10 year yield is a lot higher than the 2 year yield) it generally means one of two things: either (a) the market is worried about inflation, and is therefore requiring a high interest rate to entice people to invest in Treasuries long term, or (b) the economy is so strong that investors prefer to put their money in more risky assets and therefore Treasuries have to offer a higher rate to get people interested. For the most part, the US yield curve has been in the second camp. 

As the Fed has been raising the Fed Funds rate, the yield on shorter-term paper (like the 2 year) has been going up faster than the rate on the 10 year. Historically, the yield curve has flattened during tightening cycles, so this is nothing to be alarmed about. If the yield curve inverts, then that has historically been associated with the Fed overdoing it and it is taken as a recessionary signal. In the current environment, the flattening of the yield curve looks more like typical curve behavior during a tightening cycle, and not a signal of a recession. Don't forget the yield curve has been highly influenced by central bank behavior. The Fed could drive up long-term rates by hinting at the possibility of selling some of its portfolio. Bottom line, the business press will be talking about the curve more and more, especially if the trade war begins to snowball and we start seeing a combination of rising input costs with a slowing out output. 

New Home sales increased 6.7% MOM and 14.1% YOY to a seasonally adjusted annual rate of 689,000. This is the highest print since November last year. Interestingly, sales rose in the South, but fell everywhere else. In the West, where the supply shortage is most acute, sales fell by 9% MOM and are flat YOY. Both the median and average sales price fell, which is surprising given the torrid pace of home price appreciation in the home price indices like Case-Shiller and the jump in existing home sales prices according to NAR. It appears that more sales at the lower price points was behind the drop. Luxury sales have been more or less flat for the past year. Eventually tax reform is going to have an effect on the top end of the market, as luxury real estate is simply more expensive due to the changes in mortgage interest and the fact that most of the $1MM+ inventory is in high tax states. We will get more of a read on new homes this week as Lennar and KB both report earnings. 

Fears of rising interest rates have clearly had no negative effects on new home sales. Given the acute housing shortage and the fact that rates are still very low historically, this isn't really a surprise


The Trump Administration announced a plan to reorganize many governmental agencies. The biggest one would merge the Department of Labor and the Department of Education into one agency. On the housing side, USDA loans would be moved from USDA to HUD, which is where they probably belonged in the first place. VA loans will remain under the VA however. Community Development Block Grants would move to Commerce from HUD. The document discusses the need to reform the GSEs and lays out broad ideas, but nothing concrete. 


Tuesday, April 24, 2018

Vital Statistics:

Last Change
S&P futures 2682 10.5
Eurostoxx index 383.28 0.1
Oil (WTI) 68.68 0.01
10 Year Government Bond Yield 2.99%
30 Year fixed rate mortgage 4.56%

Stocks are up this morning on strong earnings by Caterpillar. Bonds and MBS are down. 

New Home Sales rose 4% MOM and 8.8% YOY to an annualized pace of 694,000 in March. The median sales price was$337,200 and the inventory of 301,000 represented about 5 month's worth. The number was well above Street estimates, however the confidence interval for this estimate is invariably wide. 

Consumer Confidence improved to 128.8 in April as tax cuts have pushed sentiment to post-recession highs. 

Home price appreciation is accelerating, with the Case-Shiller Home Price index up 6.8% YOY. We saw double-digit annual increases in San Francisco, Seattle, and Las Vegas. 

The FHFA House Price Index reported a bigger increase - 7.2% YOY. The FHFA index only covers conventional loans, so it is a narrower index than Case - Shiller. The increases ranged from 4.8% in the Middle Atlantic to 10.3% in the Pacific.


What is the issue with the lack of home construction? Lack of labor. The construction industry has about 250,000 unfilled jobs right now, according to the NAHB. At the peak of the bubble, there were about 5 million people in construction; today that number is closer to 3.8 million. Many of these workers found employment in other industries (especially energy extraction) and aren't about to go back. Immigration restrictions are another headache, as the government estimates that 13% of the construction workforce is working illegally. Finally, the opiod epidemic is particularly problematic in an industry where people are likely to be injured on the job and in pain generally. Ultimately, wages will have to increase to the point to lure a new generation of construction workers out of their climate controlled offices. 

Round numbers always bring out the strategists, and as the 10 year sits close to the 3% level, we are seeing pieces discussing the asset allocation implications. Since the financial crisis, the earnings yield on the S&P 500 has been higher than the 10 year, although the premium is at the lowest level since 2010. One strategist thinks the 1950s are a good analogy for investors, where interest rates gradually rose as the memories of the Great Depression faded and the economy was strong. As an aside, Jim Grant discusses how the big retail investor trade in the 1950s was the leveraged curve flattener, where people would borrow short term money to invest in long-term Treasuries. That trade worked until the bond market crashed in the late 50s and a lot of people got carried out. 

Is demand falling for houses? According to Redfin's Housing Demand Index it is. “Abnormally late winter weather and an early Easter likely delayed homeowners planning to list their homes for sale in March,” said Redfin chief economist Nela Richardson. “While inventory levels are still not nearly high enough to meet strong buyer demand, we do expect new listings to pick up in April and May.”

The House has introduced legislation to end regulation by enforcement by the CFPB. HR 5534 would require the CFPB to provide guidance on its regulations and to establish a framework for monetary penalties. 

Friday, March 23, 2018

Morning Report: Durable Goods increase smartly

Vital Statistics:

Last Change
S&P futures 2648.75 5
Eurostoxx index 365.94 -3.21
Oil (WTI) 64.54 0.24
10 Year Government Bond Yield 2.84%
30 Year fixed rate mortgage 4.46%

Stocks are higher this morning after yesterday's bloodbath. Bonds and MBS are down small. 

Troubles with Facebook and the potential for a trade war with China caused a 3% decline in the stock market yesterday. This pushed the 10 year bond yield down towards 2.8%. 

New Home Sales came in at 618k, more or less flat on a MOM and YOY basis. 

Durable Goods orders came in much stronger than expected, increasing 3.1% MOM and almost 9% YOY. Ex-transportation, they rose 1.9% MOM and 8.1% YOY. Core Capital Goods orders (a proxy for business investment / capital expenditures) rose 1.8% MOM and 8% YOY. We might see some strategists bump up their Q1 GDP numbers on that reading. 

KB Home reported first quarter earnings that missed on the top line; however the stock was up regardless after hours. Operating Margins improved, driven by an increase in gross margins. Bottom line numbers are not really comparable given the big adjustment to deferred tax assets as a result of the corporate tax cut. It is interesting to see an increase in gross margins, which have been falling pretty much across the industry. Perhaps it is a sign that home price growth is again outstripping cost growth (particularly labor and commodities). 

The Senate passed a $1.3 trillion spending bill that will keep the government open. Donald Trump is mulling a veto over wall funding, but that is probably just noise. 

Historically, house prices and the homeownership rate have correlated rather closely, but that broke down after house prices bottomed in 2012. What is going on? The first question to ask is whether the increase in homeownership that started in the mid-90s was due to increasing home prices or something else. We know that the Clinton Administration began to pull on some policy levers (and jawbone the GSEs) to increase lending to underserved markets and areas. 

The wealth that was being created in the stock market rally probably helped as well. Easy credit during the bubble also pulled some people into the housing market as well. Once the bubble popped, many people lost their homes and became renters. Finally, tight supply in the aftermath of the bubble is preventing many from buying, and professional investors who are buying starter homes to rent them out are exacerbating the problem. 


Prepayments hit a 4 year low, according to Black Knight Financial Service's First Look on February mortgage performance data. Foreclosure starts fell 25% MOM after spiking in January. Hurricane-related delinquencies fell. 

Realtor.com says that this Spring Selling Season is set to become one of the most competitive ever, with lots of buyers who were unable to find anything last year competing with new homebuyers. How are homebuyers reacting to the environment? Increasing down payments, increasing earnest money, and bidding through the asking price. 

Monday, February 26, 2018

Morning Report: New Home Sales fall

Vital Statistics:

Last Change
S&P Futures  2757.3 8.5
Eurostoxx Index 383.2 2.1
Oil (WTI) 63.3 -0.2
US dollar index 83.5 -0.1
10 Year Govt Bond Yield 2.85%
Current Coupon Fannie Mae TBA 103.591
Current Coupon Ginnie Mae TBA 103.688
30 Year Fixed Rate Mortgage 4.4

Stocks are higher this morning on the back of global strength overnight. Bonds and MBS are up. 

The highlight of the week will probably be new Fed Chairman Jerome Powell's testimony in front of Congress. There probably won't be anything market-moving (the questions will probably focus on financial regulation and wage inflation), but just be aware. He testifies on Tuesday and Thursday. The jobs report will be released next Friday, not this one. 

Economic activity moderated slightly in January, according to the Chicago Fed National Activity Index. The 3 month moving average fell as an unusually strong October reading fell off. 

New Home Sales fell in January to 593,000. December was revised upward. The median price rose to 323,000. Inventory stood at just over 300k, which amounts to about 6 month's worth of inventory at the current sales pace. 

Goldman is forecasting a 3.25% 10 year yield by the end of the year, adding that if bond yields hit 4.5% you could see a big sell-off in the stock market (no kidding). Surprisingly, they don't think that sort of yield would trigger a recession. 

Quantitative hedge funds are having their worst month in 17 years, especially the trend-following ones. Some of these funds are down 10% plus this month. If this continues, expect to see redemption notices being filed, which means they will be unwinding positions. One of the biggest positions on the street, aside from being long stocks is being short bonds. This will actually provide some support for bond prices, which means that we could be looking at stable / rising rates in the near term. 

Very surprising stat: Since the bubble peak, the median home price is up about 4.5% and the Case-Shiller Index is up 6.5%. The new home median price is up 27.5%. This demonstrates just how much the homebuilders focused on the luxury market after the bust. I think it also reflects a push towards urban construction as well. 

As the Spring Selling Season begins, inventory is sparse. Most homebuyers have been searching for 3 months or more. The biggest issue? Finding a house they can afford. 

Fannie Mae has almost delivered the 10% return on the preferred stock it sold the government during the financial crisis. Freddie has further to go. Once the GSEs pay their 10%, the preferred stock could be retired, perhaps in exchange for housing reform. 

Wednesday, October 25, 2017

Morning Report: New Home Sales rise smartly

Vital Statistics:

Last Change
S&P Futures  2564.0 -3.3
Eurostoxx Index 389.9 0.6
Oil (WTI) 52.3 -0.2
US dollar index 87.3 0.0
10 Year Govt Bond Yield 2.46%
Current Coupon Fannie Mae TBA 102.875
Current Coupon Ginnie Mae TBA 103.938
30 Year Fixed Rate Mortgage 3.93

Stocks are lower on no real news. Bonds and MBS are down. 

Stocks are in the middle of earnings season. Companies that beat their numbers are seeing a slight bump, while companies that miss are being taken to the woodshed. AMD is down 8% this morning, and Chipotle is down 14%. This has been a historical warning sign for stocks, along with declining breadth. 

New Home Sales shocked to the upside, rising 19% MOM and 17% YOY to an annualized pace of 667,000. FWIW, the margin of error on these estimates out of Census is gargantuan, and building permits / housing starts have not really confirmed this data. Regardless, it is great news, if it holds up. The biggest growth was in the South, although we saw increases everywhere. 

Mortgage Applications fell 4.6% last week as purchases fell 6% and refis fell 3%. Rising rates affected the numbers as well as the comparison to the holiday-shortened week previously. Overall, mortgage rates increased about 4 basis points to 4.18%. The purchase index is up 10% YOY. 

Durable goods orders came in better than expected, increasing 2.2%, a touch better than expectations. Ex-transportation, they rose 0.7%. Core capital goods expenditures rose 1.3%. 

Home prices rose 0.7% MOM and 6.6% YOY, according to the FHFA House Price Index. 

The 10 year bond yield is trading above 2.4% - a key technical level over the past year. If it holds, it means the bond bears might have their day at last. Much of this will depend on whether we get tax reform, and what shape it takes. Republicans are supposedly releasing their tax bill on November 1. 

Machinations in DC are not the only thing influencing bonds, though. Overseas strength is also playing a role here: the UK economy grew faster than expected, and German business confidence is at a high. Despite the differences between economies, sovereign debt does trade as an asset class and therefore strength and weakness overseas will flow through to our bond market. 

One thing to keep in mind is that mortgage rates generally lag Treasuries. In other words, if the 10 year bond yield spikes, mortgage rates will generally take a few days to adjust. So, if you are floating and wondering whether to lock, mortgage rates will probably move up over the course of the next few days if this level holds in the 10 year. It pays to check the movements in the 10 year and the mortgage market to get an idea of where mortgage rates are headed over a day or two. 

Arizona Senator Jeff Flake announced yesterday that he will not run for re-election. Republicans have a huge advantage in the Senate midterms as they are defending only a few seats while Democrats are defending a lot. There was always a rift in the Republican Party between Trump and Establishment Republicans, who were never comfortable with each other. Establishment Republicans like Corker and Flake were going to be primaried, and it appears that their constituents are further to the right than they are. Despite all the media spin, Jeff Flake was going to have a tough re-election anyway. This is nothing new: In 2010, Republicans hoped to re-take the Senate, however they ran some Tea Party types who ended up losing. The entire US electorate is becoming more polarized, which makes legislation all that more difficult, and shows the importance of controlling the regulatory agencies. 

Fannie Mae is collaborating with fintech companies to launch Single Source Validation, part of its Day 1 Certainty program. Single Source Validation will augment a borrower's credit report with data from other sources. The program is being piloted right now with Quicken. They are also working with companies to improve security and to allow lenders to get info directly from the borrower's bank without having to scan and email statements. 

Tuesday, September 26, 2017

Morning Report: Janet Yellen speaks at 11:50 today

Vital Statistics:

Last Change
S&P Futures  2495.8 -1.3
Eurostoxx Index 384.1 0.2
Oil (WTI) 51.9 -0.4
US dollar index 86.1 0.3
10 Year Govt Bond Yield 2.22%
Current Coupon Fannie Mae TBA 103.24
Current Coupon Ginnie Mae TBA 104.21
30 Year Fixed Rate Mortgage 3.85

Stocks are lower this morning as we await a Janet Yellen speech at lunchtime. Bonds and MBS are flat. 

Janet Yellen will address inflation, uncertainty, and monetary policy at the National Association of Business Economics today. Charles Evans, Lael Brainard, and Loretta Mester also speak this morning. There probably won't be any market-moving comments, but just be aware. 

Charles Evans said he won't support further rate hikes until we see clearer signs of inflation. This puts him in the camp of Neel Kashkari, who also doesn't see the need to tap on the brakes. The dot plot from the last meeting showed 11 out of 16 members forecasting a rate hike in December. The Fed Funds futures are pricing in a 3/4% chance of a rate hike. This is the highest we have seen in this contract. Note the futures are predicting nothing happens in the November meeting. 

Case-Shiller is out this morning, and home prices are up 5.9% YOY. The Pacific Northwest continues to outperform, with Seattle up 13.5% and Portland up 7.6%. Separately, home prices rose 0.5% MOM and are up 6.2% YOY, according to the Black Knight Financial Services Home Price Index. We are starting to see the areas around DC cool down, while New York (especially upstate) is beginning to pick up. 

New Home Sales fell to 560k in August, according to the Census Bureau. This is a drop of 3.4% MOM and 1.2% YOY. Tight inventory remains the biggest problem. The median sales price of a new home was $300,200, and inventory was about 284k or 6.1 month's worth. The Street was looking for 583k. 

Consumer confidence slipped in September, according to the Conference Board. The index came in at 119.8, a touch below expectations. Expectations concerning employment and income contributed to the strong showing. 

Wednesday, August 23, 2017

Morning Report: Are we heading into a recession?

Vital Statistics:

Last Change
S&P Futures  2443.0 -9.8
Eurostoxx Index 374.4 -1.5
Oil (WTI) 47.7 0.3
US dollar index 86.1 0.3
10 Year Govt Bond Yield 2.20%
Current Coupon Fannie Mae TBA 103.09
Current Coupon Ginnie Mae TBA 103.97
30 Year Fixed Rate Mortgage 3.89

Stocks are lower this morning after Donald Trump threatened to shut down the government over a wall. Bonds and MBS are up small. 

Mortgage Applications dipped half a percent last week as purchases fell 2% and refis rose 0.3%. The average rate on a 30 year fixed was unchanged, while jumbos dropped 5 basis points. Mortgage rates are back at the lows of November 2016.

New Home Sales slipped to 571,000 in July, which was lower than expectations. 

For all the talk about Millennials wanting to stay in cities, many are beginning to move to the suburbs. I guess it was only a matter of time. That age cohort is now the biggest group in the housing market. They are starting later than previous generations, however and the median age for a first time homebuyer is 33, which has been inching upward for decades. So, for all the handwringing articles about this generation being reluctant to buy houses, it turns out that they are pretty much like every generation before them: preferring to live in urban areas until they get married and have kids. That said, they are largely renters for the moment, as a combination of a dearth of starter homes and high student loan debt keeps them from buying. Eventually builders will realize there is an opportunity in starter homes, but as of now they are remaining lean and are stymied by regulation and a lack of skilled labor. 

Several investment banks are warning that we are approaching the tail end of the expansion and are heading for another recession. They note that global correlations (in other words markets all moving together) has broken down and is back at levels we saw back in 2005. They also cite the fact that companies that beat earnings estimates are not seeing the sort of pop we are used to seeing. We also could be seeing a downturn in profits just as equity valuations reach stretched levels. FWIW, the fact that we are not seeing inflation provides some comfort. Most recessions in the past were driven by an overheating economy (low unemployment, high resource utilization) which caused inflation and tightening from the Fed. We aren't seeing that at all today - in fact the fear is that inflation is too low. The Fed has been increasing rates not to slow the economy, but to eliminate some of the distortions caused by rates sitting at the zero bound. While you can't rule out some sort of black swan event (some sort of shock that comes out of left field) the imbalances that usually precede Fed-driven recessions simply aren't there at the moment, aside from a low unemployment number. 


Friday, June 23, 2017

Morning Report: New Home Sales exceed expectations

Vital Statistics:

Last Change
S&P Futures  2433.0 1.3
Eurostoxx Index 387.2 -1.3
Oil (WTI) 42.9 0.1
US dollar index 88.7 -0.1
10 Year Govt Bond Yield 2.15%
Current Coupon Fannie Mae TBA 103.31
Current Coupon Ginnie Mae TBA 104.375
30 Year Fixed Rate Mortgage 3.92

Stocks are flattish after the Fed gave a clean bill of health to the banks it stress-tested. Bonds and MBS are up small. 

One year ago today, the UK voted to leave the EU, which ignited a big rally in the bond market and pushed the 10 year down to a 1.37% yield. 

New Home Sales ticked up in May to a seasonally adjusted pace of 610k. This was up 2.9% MOM and 8.9% YOY.  The median new home sales price was $345,800 and the average price was $406,400. There are 268,000 new homes for sale at the moment. The 610k print was pretty much the average for the US from 1965-1995. New home sales peaked at over 1.3 million during the bubble years, but we are still a long way from normalcy, given population growth and obsolescence. 


34 systemically important banks passed their stress tests yesterday. The banks are getting better at passing these exams, and the sense is that the Trump Administration will nominate someone to the Fed who will dial back these exams a bit. Next week, the Fed will release its comprehensive capital review, which will determine whether the big banks can increase their dividends or buy back stock. 

Here is a good way to determine how tight a local housing market is: compare the ratio of new jobs to new building permits. In the Bay Area, that ratio is 6.4x: over the past 5 years, that MSA has added 373,000 new jobs, but has issued permits for only 58,000 new units. Lack of land, along with regulatory issues are holding back building there. In less constrained MSAs (both land and regulation) like Houston, the ratio is 1.3x. For the whole US, the country added just about 2.2 million jobs in 2016 and building permits totaled about 1.2 million, or a ratio of 1.8x. 

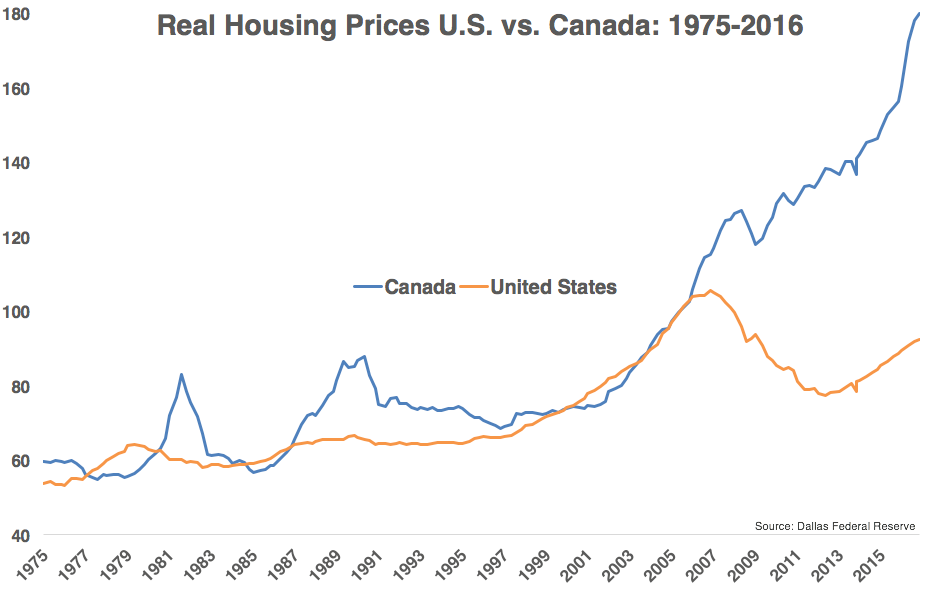
The Canadian housing bubble continues to defy gravity, but the signs are there that its days are probably numbered. Warren Buffet took a 38% stake in troubled Canadian lender Home Capital and agreed to provide a $2 billion line. You can see from the chart below how far the Canadian bubble has exceeded the US one: Note that these are inflation-adjusted indices which is why US prices appear to have not recouped the losses from the bubble years. They have on a nominal basis, but not an inflation-adjusted basis. 


The current median house price in Canada is about 520k and the median income is about 76k, putting the median house price to median income ratio at 6.8x. The US ratio peaked at 4.8x, which gives you some idea of how far prices have gone up North. Once the bubble bursts, it is bound to have some knock-on effects in the US, especially at the high end of the market which is probably more linked to China's bubble than people care to admit. 

The US Government has recommended that the new benchmark short term rate become the Treasury repo rate instead of LIBOR, which is subject to manipulation (as we saw in the UK). Not sure how this will affect current adjustable rate mortgages, but new ones will probably lose LIBOR and will use constant maturity treasuries or some alternative index. 

Tuesday, May 23, 2017

Morning Report - new home sales disappoint

Vital Statistics:

Last Change
S&P Futures  2396.3 3.5
Eurostoxx Index 392.3 1.1
Oil (WTI) 51.1 -0.1
US dollar index 88.6
10 Year Govt Bond Yield 2.25%
Current Coupon Fannie Mae TBA 102.6
Current Coupon Ginnie Mae TBA 103.81
30 Year Fixed Rate Mortgage 4

Stocks are higher this morning despite a terrorist attack in the UK. Bonds and MBS are up.

New Home sales came in at 569,000, lower than the 620,000 estimate. The median new home sale price was 309k. The average was 369k. New Home Sales are still lagging population growth.


The Richmond Fed Manufacturing Index declined in April as well. 

The DC Appeals Court will hear arguments Wednesday to reconsider its decision that the current structure of the CFPB is unconstitutional. If the CFPB loses its case, it will probably have to be re-worked, with a committee instead of a single director who will be accountable to the President. Trump has said he isn't in favor of killing the agency, but would like to make some modifications. 

Merrill Lynch is taking down its inflation forecasts for the year. They are taking their estimate for end of 2017 CPI to 1.9% from 2.3% and its estimate for core PCE to 1.7% from 1.9%. The core PCE is the inflationary index the Fed targets. Merrill is identifying some transitory drivers, so they expect inflation to return to target levels in 2018. Don't forget, we will get the FOMC minutes tomorrow, which will give some further color on what the Fed was thinking last month, especially given the political environment in DC. Their Fed Funds forecast was based on an assumption that fiscal stimulus will get passed, and that looks impossible at this point. 

Minneapolis Fed Head Neel Kashkari wants to see more data before making a decision on a June hike. The June Fed Funds futures are factoring at 78% chance of a 25 basis point hike. Note as well that the yield curve continues to flatten from its post-election steepening. The twos-tens spread (basically the difference between the 10 year yield and the 2 year yield) is the lowest since October. 

Trump outlined his proposed budget, which cuts domestic spending by $3.6 trillion over 10 years. His budget doesn't touch Social Security, Medicare, or defense. This is largely an ideological document that will never pass - in fact one of Obama's proposed budgets couldn't muster up even one Democratic vote. There is talk that the budget will cut HUD's Community Development Block Grant Program, which runs Meals on Wheels and also doles out money for things like bike lanes, public spaces, etc. Based on trial balloons floated earlier in the administration the rest of HUD's budget looks like it will be untouched. 


Tuesday, April 25, 2017

Morning Report: Strong new home sales

Vital Statistics:

Last Change
S&P Futures  2375.3 5.3
Eurostoxx Index 387.5 1.4
Oil (WTI) 49.2 0.0
US dollar index 89.5 0.1
10 Year Govt Bond Yield 2.31%
Current Coupon Fannie Mae TBA 102.625
Current Coupon Ginnie Mae TBA 103.68
30 Year Fixed Rate Mortgage 3.98

Stocks are higher this morning as it looks like cooler heads are prevailing in the continuing resolution negotiations. Bonds and MBS are down small. 

New home sales increased to an annualized rate of 621k, well above the Street expectations of 587k. New Home Sales is a notoriously volatile number, but it looks like the Spring Selling Season is off to a good start. 

Pulte announced earnings this morning, with a 14% increase in revenues and a 17% increase in earnings. CEO Ryan Marshall had this to say about the spring selling season: “Buyer interest during the spring selling season of 2017 has been high and points to the ongoing strength in recovery for the housing industry. Strong buyer demand continues to be supported by an improving economy and resulting employment and wage gains, high consumer confidence, a low inventory of new and existing homes, and the powerful demographic forces of Millennials and Baby Boomers. Given the strength of our land pipeline and our disciplined investment practices, PulteGroup is well positioned to grow its market presence and improve its financial performance within this operating environment.” Note that gross margins fell by 230 basis points, which shows costs are outpacing price growth. 

In other economic data, consumer confidence slipped in April, but is still strong, while the State Street Investor Confidence Index unexpectedly rose. The Richmond Fed Manufacturing Index improved as well. 

Home price appreciation accelerated in February, according to the FHFA House Price Index. Prices were up 0.8% MOM and are up 6.4% annually. Prices have risen 6.2% annually since bottoming in early 2012. Regionally, the Mountain states had the biggest increase, coming in at 9.5%. Even New England, historically a laggard, increased by 6.5%. The worst area - Mid atlantic - rose 4.6%. 


Meanwhile, the Case-Shiller Home Price Index rose 0.7% MOM and is up 5.9% YOY. 

In politics, Donald Trump seemed to moderate his comments about marrying the wall with funding the government through the end of the fiscal year. Given that Republicans hold all 3 branches of government, why does Trump need Democrats? The reason is the same thing that vexed Obama: The House Freedom Caucus, who won't support anything that doesn't repeal Obamacare or cut spending enough. This gives Chuck Schumer and the Democrats more leverage than they would ordinarily have. Note Congress can play some accounting games to move the deadline back a couple of weeks, so this Friday isn't necessarily a drop-dead date. A government shutdown is probably unlikely, but LOs should be thinking about ordering 4506-Ts if they need them. 

Donald Trump is targeting a corporate tax rate of 15%, which will be unveiled tomorrow. House Speaker Paul Ryan is closer to 20%, and believes that 15% is too low to be revenue-neutral. While even Democrats recognize our corporate taxes are too high, they won't get onboard anything that amounts to a tax cut. Take a look at the chart below. It has our taxes (and our competitors') tax rates from 2000 to 2016. Pretty much everyone has cut taxes except for us. Trump will also reveal a plan for individual income taxes as well. 


Having trouble saving? There's an ap for that. New fintech companies are micro-analyzing an individual's earnings and spending patters, and using credit and savings sweeping to normalize their client's income (think a freelancer or an Uber driver). Some will pay all your bills for you, and others will ensure your checking account doesn't overdraft. Some will extend credit at high rates, however those rates are generally better than payday lenders. 

Another blow for cheap new housing construction. The US is imposing tariffs on Canadian softwood exports in an ongoing trade dispute. Softwood (basically pine) is primarily used for framing in housing, so we could see lumber prices increase further. While "sticks and bricks" are not the main driver of housing construction cost, this doesn't help matters. It is getting to be a problem when the typical starter home is unaffordable to its target market. 

The MBA has rolled out its plan for the GSEs. The idea would be to turn Fannie and Freddie into public utilities and to take steps to open up the market for private mortgage guarantors. They estimate it could take up to 10 years to implement. Note the clock is ticking: As the government continues to sweep all of Fannie's profits to Treasury, their net worth is decreasing. 

Thursday, March 23, 2017

Morning Report: New home sales surprise to the upside

Vital Statistics:

Last Change
S&P Futures  2346.3 3.8
Eurostoxx Index 375.2 1.1
Oil (WTI) 47.5 -0.7
US dollar index 90.0
10 Year Govt Bond Yield 2.40%
Current Coupon Fannie Mae TBA 102.22
Current Coupon Ginnie Mae TBA 103.45
30 Year Fixed Rate Mortgage 4.17

Stocks are up this morning on no real news. Bonds and MBS are up small. 

Initial Jobless Claims came in at 258k, a small uptick from the week before. This is a 7 week high, but still very low historically. 

New Home Sales rose to 592k, higher than expectations. New home sales are approaching historical normalcy, however they are well lower than what is needed to meet pent-up demand and population growth. There are currently 266,000 homes for sale This represents a 5.4 month supply. 


Congress and Donald Trump are making last minute changes to the replacement for Obamacare in an attempt to swing conservatives who feel the bill doesn't go far enough. Democrats are united in opposition. Dealing with healthcare (and the future spending cuts it entails) lays the groundwork for infrastructure spending and tax reform. This in turn will affect the bond market, so progress on healthcare = higher interest rates, at least at the margin. 

As the bond market re-adjusts its expectations for fiscal stimulus, longer - term rates have been falling, which means the yield curve is flattening. This is generally bad news for stocks. Know who it is good for? Borrowers who have adjustable rate mortgages and want the certainty of a 30 year fixed rate payment. ARMs reset based on short term rates, which the Fed is moving upward. As the curve flattens, the relative attractiveness of 30 year fixed rates versus ARMs increases. The other big opportunity is refinancing older FHA loans which have built up sufficient equity to go into a conventional loan. There are still refi opportunities even in a rising rate environment. 

Prepayment speeds (i.e. refinance activity) are down 40% YTD according to Black Knight Financial Services. Delinquencies are down to 4.21%, a drop of .98% MOM and 5.51% YOY. Foreclosure starts fell 18% MOM and are down 37% YOY to just over 57,000. The Deep South remains the area hardest hit by foreclosures, while the Northeast saw the biggest improvement, with New Jersey and New York leading the way. 

House Financial Services Chairman Jeb Hensarling says that reforming Dodd-Frank remains a 2016 priority. Meanwhile, the bankers are adjusting their expectations for any changes. Getting any reform through the Senate is going to be a difficult job to say the least and will require bipartisan support. 

Ray Dalio of Bridgewater has a long paper on populism and how it may affect the economy more than monetary or fiscal policy. Populism has been largely dormant since the 1930s, but seems to be expressing itself in developed countries as well as emerging ones. 


Friday, February 24, 2017

Morning Report: New home sales rise in January

Vital Statistics:

Last Change
S&P Futures  2351.5 -11.0
Eurostoxx Index 368.0 -4.9
Oil (WTI) 53.8 -0.7
US dollar index 90.7
10 Year Govt Bond Yield 2.33%
Current Coupon Fannie Mae TBA 102.045
Current Coupon Ginnie Mae TBA 103.17
30 Year Fixed Rate Mortgage 4.12

Stocks are down this morning on disappointing earnings and slumping commodity prices. Bonds and MBS are up. 

Consumer sentiment flattened out in February, according to the University of Michigan consumer sentiment survey. 

New home sales rose 5.5% YOY to 555,000 in January. This is 3.7% above the revised December reading. The median new home price was $312,900 and the average price was $360,900. At the end of the month, there were 265,000 new homes for sale, which represents a 5.7 month supply. You can see from the chart we are barely back to pre-1990 levels which doesn't even take into account things like population growth and obsolescence. 


Donald Trump is scheduled to speak at CPAC this morning. Shouldn't be market-moving, but just be aware. 

Bonds have been rallying a touch on a report that Donald Trump's infrastructure plan will be moved out to 2018. The thinking is that Democrats are united in opposition at the moment (there is a lot of handwringing over handshaking), but by 2018, midterm elections will be looming and Trump could pick off some Democratic Senators up for re-election in states Trump won like Jon Tester or Claire McCaskill. Given that the Fed's forecast of 2-3 rate hikes in 2017 was contingent on fiscal stimulus, this could ultimately push the Fed to hike only twice this year.

Morgan Stanley is out with a call saying the housing recovery is still in the "middle innings." That is probably a fair assessment, however the building boom required to balance out supply and demand has yet to happen. As we know, the market for starter homes is extremely tight as builders focused on the luxury end of the market post-crisis and professional investors bought up small houses to turn into rentals. 

Did you know that if you wanted to lend money to the German Government for two years, it would cost you almost a percent per year? In other words, you would have to pay 101.73 to get back 100 in two years. Demand for safe collateral in Europe as well as fears of the French election have pushed German 2 year yields to -95 basis points. Strange times we live in. 

We are starting to see selling pressure at the ultra-high end of the real estate market as the new Chinese capital controls take effect. In an attempt to control currency outflows, the Chinese government imposed controls which limit real estate investments overseas. The most vulnerable cities are on the West Coast, particularly Seattle and San Francisco, although it should hit all of the big urban areas. Big McMansions which used to be snapped up in days now sit vacant in LA. 

Thursday, January 26, 2017

Morning Report: New home sales drop

Vital Statistics:

Last Change
S&P Futures  2294.5 0.5
Eurostoxx Index 367.7 1.1
Oil (WTI) 53.1 0.3
US dollar index 91.2 0.4
10 Year Govt Bond Yield 2.53%
Current Coupon Fannie Mae TBA 102.1
Current Coupon Ginnie Mae TBA 103.2
30 Year Fixed Rate Mortgage 4.16

Stocks are flattish as earnings roll in. Bonds and MBS are down small. 

New Home sales fell pretty dramatically in December, to an annualized pace of 536k from November's revised 598k number. New home sales is a notoriously volatile number, so don't read too much into it. The 3 month moving average has been pretty steady for the past 6 months. The median sales price was $322k (up about 7.8%) and the average sales price was $384k (up 7.2%). There were about 259,000 units for sale at the end of December, which represents a 5.8 month supply at the current rate. Sales were flat in the West, rose in the Northeast, and fell in the Midwest and South. 

Initial Jobless Claims rose last week to 259k from 239k the week before. 

The Chicago Fed National Activity Index improved in December to .14 from -33 the month before. This is a meta-index of about 85 different variables, some of which lag quite a bit. The 3 month moving average was still negative however. Production related indices drove the increase, while consumption and housing became somewhat less negative. Employment was flat. 

The Index of Leading Economic Indicators improved to 0.5% in December versus 0.1% in November. 

At 2:00 PM EST, I will be participating in Housing Wire's 2017 outlook webinar, where I will discuss the Fed, interest rates, and why fears of further hikes in mortgage rates might be overblown. Here is the link to the webinar. Other subjects include the regulatory environment in Washington DC as well as the latest developments in mortgage insurance premiums. Registration is free. 

Despite the change in MIP, Washington might be coming to a consensus that tight credit in the housing market is a problem and it might be time to roll back some of the more restrictive regulatory policies and begin to encourage homeownership. Now that the housing market is back to record highs, liberals want to see more lending to lower credit / income borrowers and are realizing that bashing the banks isn't the best way to go about it. On the other side of the aisle, conservatives are becoming more accepting of government social engineering via the housing market and want to see housing starts rebound to some semblance of normalcy. Of course the elephant in the room is the mortgage interest deduction, which could become a casualty of tax reform. 

What Dow 20,000 means for mortgage rates. Punch line: not much. It is indicative of the current "risk-on" mentality of investors, where they sell safer assets like Treasuries to buy stocks. At the margin, this does push up interest rates, however that doesn't necessarily mean mortgage rates move up in lockstep. Note that Dow 20,000 doesn't have nearly the hype associated with it as Dow 10,000 had. That is the difference between the tail end of a secular bull market and the tail end of a secular bear market. It took the Dow roughly 17 years to double between 10,000 and 20,000. During the 80s-90s stock bull market, the Dow quintupled from 1982-1999. Dow 10,000 was the age of stock split beepers, "poof IPOs," and companies that found they could double their multiple by adding ".com" to their corporate moniker. This time around, investors are more jaded. 

One strategist expects the Fed to begin a rapid-fire 25 basis point every quarter starting in late 2017. The consensus is that the Fed would really like to see the Fed Funds rate at 3%, which it considers a "normal" level. Much depends on what we get out of Washington and whether we get some sort of major fiscal stimulus. Aside from fiscal policy, wage inflation is probably going to be the biggest driver. 

Here are the hottest markets in real estate according to Realtor.com. Some markets are what you would expect to see (like San Francisco) while others are surprises (Fort Wayne, IN). As usual, California dominated the list with 8 of the top 10 markets. California's housing crunch is creating pushback against laws intended to discourage development.