A place where economics, financial markets, and real estate intersect.
Showing posts with label consumer confidence. Show all posts

Tuesday, August 28, 2018

Morning Report: The Fed worries about the yield curve

Vital Statistics:

       Last     Change
S&P futures29033
Eurostoxx index386.36.8
Oil (WTI)68.910.02
10 Year Government Bond Yield2.87%
30 Year Fixed rate mortgage                              4.58%

Stocks are higher this morning on optimism over trade talks with Mexico. Bonds and MBS are down. 

We saw a strong buildup of inventory in July, both at the retail level and the wholesale level. Inventory growth was negative in the second quarter, which depressed GDP growth slightly. This improvement in inventories will provide a boost to the third quarter numbers. Durable goods and autos led the increase, with retail inventories up 0.4% and wholesale inventories up 0.7%. 

Redbook reported that same store sales rose 5.1% last week, which was the third fastest pace this year. This bodes well for the back-to-school numbers which are the best predictors of the holiday shopping season. Consumption has been generally strong and these numbers bear that out.

Consumer confidence jumped to 133.4 in August according to the Conference Board. This is the highest level since late 2000. 

House prices rose 6.2% in June, according to the Case-Shiller home price index.  Las Vegas, San Francisco, and Seattle reported double-digit increases. The laggards included New York, Chicago and Washington DC which reported low single-digit gains. Las Vegas is one of the fastest growing US cities in terms of population and employment growth, which explains the rise there. Seattle and San Francisco has restricted supply along with foreign demand. On the other side, the Northeast continues to stagnate. 

The Urban Institute looked at mortgage denial rates along demographic lines and found that most of the studies that report discrimination overstate denial rates because they fail to take into account incomes and credit scores. While they still found some evidence of racial disparity it is much lower when you correct for these things. Not sure if the difference is statistically significant though. Given that CRA loans are worth more than traditional loans (all things being equal) it is surprising that there is any difference at all. 

As the long end of the curve continues to rally, we will have a steady diet of recession prediction stories in the business press. The latest Reuters story cites a Federal Reserve study that suggests the market may be warning of a potential recession: “In light of the evidence on its predictive power for recessions, the recent evolution of the yield curve suggests that recession risk might be rising,” wrote San Francisco Fed research advisers Michael Bauer and Thomas Mertens. 

The flattening yield curve provides plenty of fodder for the Wall of Worry, however there are a couple of things to bear in mind. First, the yield curve almost always flattens during a tightening cycle. Take a look at the chart below, and you can see the yield curve flatten as short term rates rise. 


The behavior of the yield curve is 100% normal. Not only that, longer term interest rates are being held artificially low due to the behavior of central bankers throughout the world. The Fed is still buying Treasuries, albeit at a slower pace, while Japanese and European central bankers are pushing down long-term rates, which influences US rates. The signal-to-noise ratio of the yield curve is extremely low right now. Finally, the short Treasury trade is probably the biggest macro bet on the Street right now. Every wiseguy is short, and that means you will sometimes get these rallies for no apparent reason. 

Tuesday, June 26, 2018

Morning Report: Case-Shiller continues to move higher

Vital Statistics:

Last Change
S&P futures 2724 1.5
Eurostoxx index 378.31 1.12
Oil (WTI) 68.22 0.14
10 Year Government Bond Yield 2.88%
30 Year fixed rate mortgage 4.57%

Stocks are flattish this morning on no real news. Bonds and MBS are up. 

Consumer confidence slipped in June, according to the Conference Board. The decline, while still high by historical standards, was driven more by a drop in the outlook than it was by a decline in current conditions. 

Home price appreciation continued in April, with some real eye-popping moves in a few MSAs. Seattle and Las Vegas were up 13%, YOY, San Francisco was up 11%. Bringing up the rear was Chicago and Washington, up 3%. While the index has hit its 2006 peak, it is important to remember these are nominal (i.e non-inflation adjusted) numbers. If you adjust for inflation, Dallas, Denver and Seattle have regained their bubble peaks, while everyone else is still lower. Inventory is still tight, but the picture is improving. 


Housing demand was up 7% in May, according to Redfin. Redfin measures housing demand by counting the number of offers and requests for home tours. Demand is actually down from a year ago, but the market is still a seller's market. 

Fears of a trade war are causing big asset allocations into government bonds. The government bond ETF GOVT saw record volume on Friday of $600 million. Momentum traders are beginning to pile into the long Treasury trade. Morgan Stanley is calling the top in yields. “While trade tensions have yet to negatively impact U.S. economic data noticeably, the Fed has started to hear more concern from business contacts. We see risk that such tension will impact economic data more in the coming months, even if a benign outcome comes to pass eventually.” FWIW, the Fed Funds futures are still handicapping a toss-up between 1 or 2 more hikes this year. 

For mortgage originators, trade fears are probably going to help keep the 10 year below 3%, though it probably won't be enough to bring back refi volume or to save the year.

Speaking of saving the year, in the second quarter cost cutting was a #1 or #2 concern for 30% of all mortgage originators. Last year, only 11% saw cost cutting as a #1 or #2 concern, focusing more on consumer-facing technology and process streamlining. In the first quarter, mortgage bankers reported a loss on production for only the second time in 10 years. 


Tuesday, April 24, 2018

Vital Statistics:

Last Change
S&P futures 2682 10.5
Eurostoxx index 383.28 0.1
Oil (WTI) 68.68 0.01
10 Year Government Bond Yield 2.99%
30 Year fixed rate mortgage 4.56%

Stocks are up this morning on strong earnings by Caterpillar. Bonds and MBS are down. 

New Home Sales rose 4% MOM and 8.8% YOY to an annualized pace of 694,000 in March. The median sales price was$337,200 and the inventory of 301,000 represented about 5 month's worth. The number was well above Street estimates, however the confidence interval for this estimate is invariably wide. 

Consumer Confidence improved to 128.8 in April as tax cuts have pushed sentiment to post-recession highs. 

Home price appreciation is accelerating, with the Case-Shiller Home Price index up 6.8% YOY. We saw double-digit annual increases in San Francisco, Seattle, and Las Vegas. 

The FHFA House Price Index reported a bigger increase - 7.2% YOY. The FHFA index only covers conventional loans, so it is a narrower index than Case - Shiller. The increases ranged from 4.8% in the Middle Atlantic to 10.3% in the Pacific.


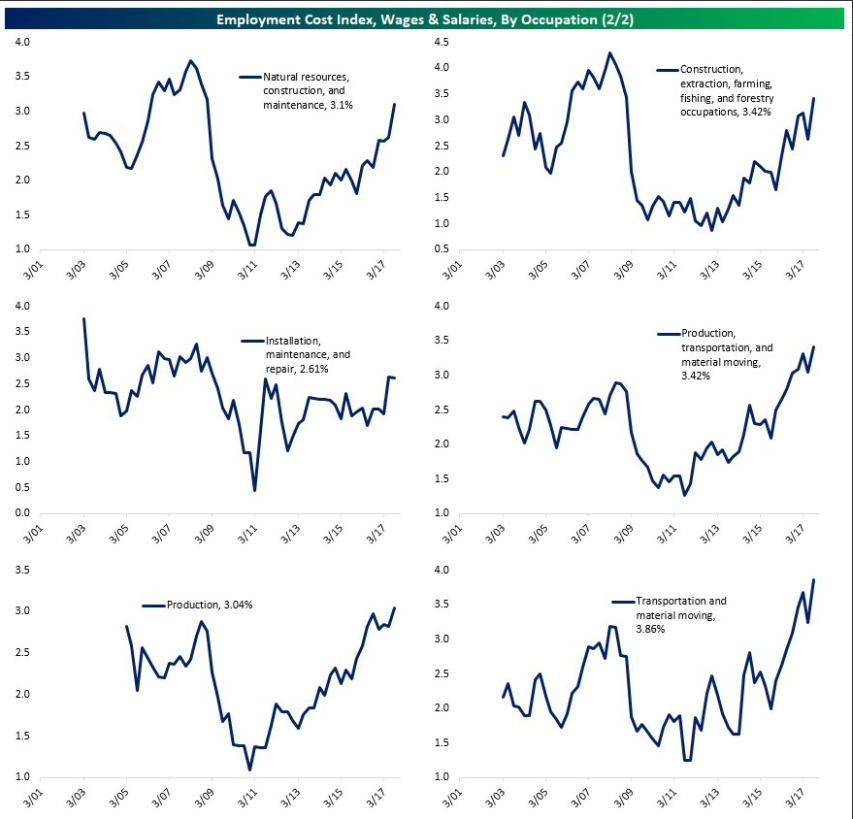
What is the issue with the lack of home construction? Lack of labor. The construction industry has about 250,000 unfilled jobs right now, according to the NAHB. At the peak of the bubble, there were about 5 million people in construction; today that number is closer to 3.8 million. Many of these workers found employment in other industries (especially energy extraction) and aren't about to go back. Immigration restrictions are another headache, as the government estimates that 13% of the construction workforce is working illegally. Finally, the opiod epidemic is particularly problematic in an industry where people are likely to be injured on the job and in pain generally. Ultimately, wages will have to increase to the point to lure a new generation of construction workers out of their climate controlled offices. 

Round numbers always bring out the strategists, and as the 10 year sits close to the 3% level, we are seeing pieces discussing the asset allocation implications. Since the financial crisis, the earnings yield on the S&P 500 has been higher than the 10 year, although the premium is at the lowest level since 2010. One strategist thinks the 1950s are a good analogy for investors, where interest rates gradually rose as the memories of the Great Depression faded and the economy was strong. As an aside, Jim Grant discusses how the big retail investor trade in the 1950s was the leveraged curve flattener, where people would borrow short term money to invest in long-term Treasuries. That trade worked until the bond market crashed in the late 50s and a lot of people got carried out. 

Is demand falling for houses? According to Redfin's Housing Demand Index it is. “Abnormally late winter weather and an early Easter likely delayed homeowners planning to list their homes for sale in March,” said Redfin chief economist Nela Richardson. “While inventory levels are still not nearly high enough to meet strong buyer demand, we do expect new listings to pick up in April and May.”

The House has introduced legislation to end regulation by enforcement by the CFPB. HR 5534 would require the CFPB to provide guidance on its regulations and to establish a framework for monetary penalties. 

Tuesday, October 31, 2017

Morning Report: Wages and confidence are rising

Vital Statistics:

Last Change
S&P Futures  2573.0 4.8
Eurostoxx Index 394.7 0.8
Oil (WTI) 54.1 -0.1
US dollar index 87.6 0.1
10 Year Govt Bond Yield 2.37%
Current Coupon Fannie Mae TBA 102.875
Current Coupon Ginnie Mae TBA 103.938
30 Year Fixed Rate Mortgage 3.99

Stocks are up this morning as we start the November FOMC meeting. Bonds and MBS are down small. 

No changes to FOMC policy are expected at this week's meeting, however the Fed Funds market is predicting a 96% chance they raise rates in December. 

Aside from the FOMC meeting, Congress is expected to unveil tax reform tomorrow, and Trump is slated to nominate the new Federal Reserve Chairman on Thursday. And on Friday, we get the all-important jobs report, so a lot going on this week. 

Despite what the business press is saying, the markets are treating the Mueller / Manafort thing as a sideshow. As of now, nothing going on there is going to affect Washington enough to rile up markets. Earnings are the focus at the moment for stocks, and economic data (along with foreign central bank policy) is driving the bond market.  

The Washington DC goat rodeo isn't affecting consumer confidence either, which just hit a 17 year high. Most notably, the job market got positive marks for strength for the first time since 2001. 

Are we starting to see stirrings of wage inflation? Perhaps. The Employment Cost Index rose 0.7% in the third quarter, faster than the 0.5% rate we saw in the second. Wages and salaries (which account for 70% of the ECI) rose 0.7%, while benefits rose 0.8%. On a year-over-year basis, they rose 2.5%. So far, bonds aren't reacting to the number. An increase in wage inflation will force the Fed to move more aggressively. For those who worry about income inequality, the biggest growth was in blue collar jobs, where wages rose 0.8% and benefits rose 1.7%. 


Home prices rose 0.5% in August and are up 5.9% for the year, according to Case-Shiller. Seattle has been on a tear, rising over 13% for the past year, followed by Las Vegas and San Diego. A strong economy along with low inventory and rates have been a support for home prices. The interest rate environment will be changing, however inventory doesn't appear to be a temporary phenomenon, and the US economy seems to be accelerating, not declining. While the usual affordability questions are mentioned, the median mortgage payment for the median house as a percent of income is still very low by historical standards. 

Note that the lack of building is simply creating pent-up demand for housing which will get satisfied eventually. That will push up growth for the next few years when it finally happens. 

Manufacturing continues to hum along, with the Chicago PMI coming in well above expectations. 

Bitcoin futures are coming... The contracts will be cash settled, not by delivery of the underlying. 

Tuesday, December 27, 2016

Morning Report: Home prices surge in October

Vital Statistics:

Last Change
S&P Futures  2261.2 1.2
Eurostoxx Index 360.5 0.5
Oil (WTI) 52.2 0.1
US dollar index 93.4 0.2
10 Year Govt Bond Yield 2.56%
Current Coupon Fannie Mae TBA 103
Current Coupon Ginnie Mae TBA 104
30 Year Fixed Rate Mortgage 4.29

Stocks are flattish this morning on no real news. Bonds and MBS are up small. 

Expect a dull week with thin volume on the exchanges as many traders take this week off. We will have some minor economic reports this week, but nothing should be market-moving. 

New Home Sales increased to 592k in November. This is an increase of 17% YOY. New home inventory is about 250k, which is a 5.1 month supply at current levels. The median sales price was $305k, while the average sales price was $359k. The Midwest and the West had the biggest increases in sales. 

Home prices rose 5.6% in October, according to the Case-Shiller Home Price Index. Affordability measures have shown 20% - 30% decreases since home prices bottomed in 2012. While affordability is not yet at a point to suggest a reversal in home price appreciation, we are probably approaching the limits of home price appreciation unless wage growth accelerates. 


Note that these indices are not inflation-adjusted. While inflation has been pretty tame over the past 10 years, it hasn't been zero. If you adjust the index for inflation, we are still below our 2006 highs.


The national foreclosure inventory fell below 500k for the first time in 10 years, according to Black Knight Financial Services. Delinquencies ticked up on a seasonal basis, but are down almost 10% YOY. Improvements in delinquencies are getting smaller as the market normalizes. 

For bond investors who were taken by surprise by the Fed's forecast of 3 rate hikes this year, it is instructive to look at how many hikes they thought they would be making this year. In fact, no one suggested less than 2. We only had one. This again stresses the data-dependency of what the Fed is thinking. GDP growth came in slower than expected, and then we had Brexit, which caused the Fed to think about being less aggressive. Ultimately, it will depend on inflation and whether it returns. Despite inflation being below the Fed's target rate, they still plan to tighten. 

Consumer confidence jumped in November, driven primarily by the election and improving expectations for future growth. Note that the current conditions part of the index actually fell, so this is largely a jump based on the perception of the future which may not play out as assumed. 

Tuesday, April 28, 2015

Morning Report - The homeownership rate continues to fall

Vital Statistics:

Last Change Percent
S&P Futures  2101.6 -3.1 -0.15%
Eurostoxx Index 3728.1 -43.3 -1.15%
Oil (WTI) 57.05 0.1 0.11%
LIBOR 0.279 0.002 0.72%
US Dollar Index (DXY) 96.47 -0.297 -0.31%
10 Year Govt Bond Yield 1.95% 0.03%
Current Coupon Ginnie Mae TBA 103.1 -0.2
Current Coupon Fannie Mae TBA 102.2 -0.3
BankRate 30 Year Fixed Rate Mortgage 3.77

Markets are flattish this morning as the FOMC begins their meeting. Bonds and MBS are down. 

Consumer Confidence slipped in April, to 95.2 from 101.3. Consumers’ appraisal of current-day conditions continued to soften. Those saying business conditions are “good” edged down from 26.7 percent to 26.5 percent. However, those claiming business conditions are “bad” also decreased from 19.4 percent to 18.2 percent. Consumers were less favorable in their assessment of the job market. Those stating jobs are “plentiful” declined from 21.0 percent to 19.1 percent, while those claiming jobs are “hard to get” rose from 25.5 percent to 26.4 percent. The current reading is just about the historical average.


The FOMC meeting begins today. This is should be the last meeting where rate hikes are off the table. Given the weak first quarter, and subsequent economic weakness, the consensus has shifted markedly from a June hike to a September hike. As an aside, we will get the advance estimate for Q1 GDP tomorrow, and the consensus is that the economy grew at 1%. Granted, some of that is weather-driven, but there is no question the economy has slowed dramatically from the Q214-Q315 pace of 4.6%-5.0%. The jobs report next week will be huge. 

Home Prices increased .93% month-over-month and 5.03% year over year, according to Case-Shiller. Overall, prices are about 10% below their 2006 peaks, however some hot markets like Denver and San Francisco have surpassed that peak already. Price inflation is being driven by a lack of supply, not wage growth, which means that prices will probably flatline once new home construction kicks into gear or until wages start increasing. We will get a good read on wages this Thursday, with personal income and personal spending. 

The homeownership rate fell to 63.7% in Q115, from 64% in the fourth quarter of 2015. Pretty much all of the increase that started with the Clinton Administration's homeownership initiatives in the mid 90s have been given back. 


Wednesday, March 27, 2013

Morning Report - Are we in a real estate bubble?

Vital Statistics

Last Change Percent
S&P Futures  1550.7 -6.5 -0.42%
Eurostoxx Index 2597.6 -43.6 -1.65%
Oil (WTI) 95.95 -0.4 -0.40%
LIBOR 0.284 0.000 0.00%
US Dollar Index (DXY) 83.21 0.328 0.40%
10 Year Govt Bond Yield 1.86% -0.05%  
RPX Composite Real Estate Index 190.8 -0.2  

Markets are lower this morning as Euro sovereign yields widen on the Cyprus situation. Mortgage applications rose 7.7% last week. This is the last full trading day of the week (Thurs is a half day), so volume should start to dry up as traders square their books for quarter-end and leave for the long weekend.  Bonds and MBS are up on the flight to safety trade.

We will have some Fed-speak today with Rosengren of Boston, Pianalto of Cleveland, and Kocherlakota speaking at various events during lunch. Hints about QE could move MBS, so watch your locks.

Consumer confidence fell in March to 57.9 from 61.4 a month earlier. The report blames Washington for the decrease. You certainly wouldn't guess it from watching the stock market indices.  It will be interesting to see how the spending numbers shake out.

New Home sales fell 4.6% MOM in February, but were up 12.3 YOY to a seasonally adjusted annual rate of 411,000 units. The median sales price was $246,800, an increase of 3% YOY. There definitely seems to be a bifurcation of the market, where existing homes are rising at a high single digit rate, yet the new home market is experiencing more modest price increases. Investor activity is probably driving the difference, as professional investors are purchasing distressed property for rentals, while new home sales are driven by actual homeowners. Volume is picking up, with the  sales in Feb up 13% from last summer.

Bob Schiller pointed out that the latest housing data should be approached with caution. He points out that markets like Phoenix and Las Vegas are "frothy" and says that the recovery may even be a bubble. FWIW, I disagree that we are in another bubble - bubbles are psychological phenomenons that start with the view that "this time is different" and that the asset in question can only go up. That was the view of residential real estate in 2006.  It isn't now. Our grandkids may experience another real estate bubble, but we won't. Schiller believes that it will take 40 years for home prices to rise to pre-2007 levels. Yes, that is an eye-opening forecast, but he is talking about inflation-adjusted numbers.

The government wants to impose a surcharge (through higher capital requirements) for the too big to fail banks. This will undoubtedly be another impetus for the big banks to break up voluntarily.

Friday, December 28, 2012

Morning Report - On the Waterfront Edition

Vital Statistics:

Last Change Percent
S&P Futures  1401.8 -8.9 -0.63%
Eurostoxx Index 2633.2 -26.8 -1.01%
Oil (WTI) 91.01 0.1 0.15%
LIBOR 0.308 -0.003 -0.96%
US Dollar Index (DXY) 79.81 0.188 0.24%
10 Year Govt Bond Yield 1.70% -0.03%  
RPX Composite Real Estate Index 192.3 0.0  

Stock index futures are lower on pessimism about a budget deal. Obama will meet with Congressional leaders today to see if they can hammer out a deal. The House will meet on Sunday night. The same story remains - stocks are worried about going over the cliff, while the bond market seems skeptical.  For a laugh, check out Rick Santelli's rant about the way the markets are handicapping it.

One other possible headwind for the economy in Q1 - a longshoreman's strike that would close cargo ports on the Eastern Seaboard and the Gulf Coast. This would not only limit raw material supplies to US factories, it would also push many logistics workers, truck drivers, etc on to the unemployment rolls. Some economists estimate that a strike could cost the US economy $1 billion a day. Will Obama risk alienating his labor base to intervene?  Fun fact:  the average compensation for a longshoreman in $124k.

Yesterday's consumer confidence numbers took a step downward, and seem to back up reports that this year's holiday sales were weak.The outlook for business conditions and labor markets fell.

Chart:  Conference Board Consumer Confidence:


In spite of the pessimism over the fiscal cliff, luxury homes priced over $1 million are making a comeback. Sales have risen by 9% for the first 9 months of 2012.  Strong foreign demand has been driving up prices in Manhattan and the Hamptons. In terms of foreclosures over $1 million, the NYC suburbs hold 4 out of the top 10 zip codes, with New Canaan taking the lead.  This is still the wreckage from the bust, where lots of $1 million a year guys lost their jobs in 2007 and haven't worked since.