A place where economics, financial markets, and real estate intersect.
Showing posts with label housing affordability. Show all posts

Friday, July 20, 2018

Morning Report: Donald Trump, the Fed and housing affordability

Vital Statistics:

Last Change
S&P futures 2801 -3.75
Eurostoxx index 385.19 -1
Oil (WTI) 69.83 0.37
10 Year Government Bond Yield 2.85%
30 Year fixed rate mortgage 4.50%

Stocks are lower after the Trump Administration threatened more tariffs on Chinese goods. Bonds and MBS are down. 

Donald Trump jawboned the Fed a little yesterday, saying he was "not thrilled" with interest rate hikes.  “I am not happy about it. But at the same time I’m letting them (the Fed) do what they feel is best.” For all the histrionics in the business press, this was pretty mild stuff. As a general rule, presidents respect the independence of the Federal Reserve and don't criticize policy all that much. Obama never criticized the Fed's monetary policy but of course he never had to deal with a tightening, so there wasn't much to complain about. Alan Greenspan was considered "The Maestro" by the business press, so both Clinton and GWB gave him a wide berth. That said, Richard Nixon criticized the Fed, and Jimmy Carter installed a political hack (G William Miller - who was a complete disaster) to run the bank, so it isn't like political meddling is unheard of. FWIW, the correlation between rising bond yields and criticism of the Fed is about 1, so expect more as we move from a secular bull market in bonds to a secular bear market. 

Trump has doubled down by tweeting about the Fed and the dollar this morning: "China, the European Union and others have been manipulating their currencies and interest rates lower, while the U.S. is raising rates while the dollars gets stronger and stronger with each passing day - taking away our big competitive edge. As usual, not a level playing field....The United States should not be penalized because we are doing so well. Tightening now hurts all that we have done. The U.S. should be allowed to recapture what was lost due to illegal currency manipulation and BAD Trade Deals. Debt coming due & we are raising rates - Really? Farmers have been on a downward trend for 15 years. The price of soybeans has fallen 50% since 5 years before the Election. A big reason is bad (terrible) Trade Deals with other countries. They put on massive Tariffs and Barriers. Canada charges 275% on Dairy. Farmers will WIN!"

These comments are smacking the dollar this morning, which is pushing up the 10 year yield. The comments have made no changed to the Fed funds futures, which are still predicting an 85% of a 25 basis point hike in September and a 58% chance of another hike in December. 

Note Russia is dumping Treasuries. Most of its position has been liquidated. This was in response to sanctions imposed earlier this year. 

Housing affordability has been falling as rates and prices rise. The most affordable places in the US are the Northeast and the Midwest. The Midwest is the most affordable despite having the highest regional mortgage rates. There is a surprising amount of variation between mortgage rates in different parts of the country - a range of 25 basis points. The Northeast has high prices (but low rates) and the Midwest has low prices (but high rates). Affordability is back to 2009 levels. 


At least one commentator thinks housing has peaked for this cycle. As a general rule, housing construction is an early cycle phenomenon - in other words it generally leads the economy out of a recession. Since this expansion is very long in the tooth, it would follow that housing might have peaked. The problem with that theory is that housing didn't show up in the early recovery - it kept falling well after the recession ended. FWIW, between the shortage we currently have and the fact that building margins are still healthy indicates housing has room to run. 

Tuesday, January 2, 2018

Morning Report: Housing is still highly affordable

Vital Statistics:

Last Change
S&P Futures  2686.3 10.6
Eurostoxx Index 389.2 -0.4
Oil (WTI) 60.1 0.2
US dollar index 86.0 -0.3
10 Year Govt Bond Yield 2.44%
Current Coupon Fannie Mae TBA 102.375
Current Coupon Ginnie Mae TBA 103.25
30 Year Fixed Rate Mortgage 3.92

Stocks are higher to start the year. Bonds and MBS are down.

We will get the FOMC minutes this Wednesday and also the jobs report on Friday. Both have the potential to be market-moving. Other than that, we will get the ISM reports and construction spending. 

Home prices continue to increase at a torrid pace, as the CoreLogic House Price Indicator has had its fourth straight month of 6% annual increases

Given the size of the rebound in the home price indices, we are seeing all sorts of questions about affordability. In the latest issue of the Scotsman Guide, I discuss home prices and affordability questions. The article was written last fall before it looked like we would get any action on tax reform. The mortgage interest deduction will now become irrelevant for most homeowners, but that doesn't necessarily mean that housing has become less affordable - at least not at the median home price and median income. Regardless, the biggest driver of housing affordability is the mortgage rate, not the house price. Affordability was the worst in the early 80s, when mortgage rates were double digits. The chart below looks at the mortgage payment as a percent of income over time. Note that the mortgage interest deduction moves the curve downward in a more or less linear fashion, and does not make much of a difference in terms of relative affordability. 


Friday, July 28, 2017

Morning Report: More on housing afforability

Vital Statistics:

Last Change
S&P Futures  2465.3 -7.0
Eurostoxx Index 378.7 -3.6
Oil (WTI) 49.1 0.0
US dollar index 86.2 -0.3
10 Year Govt Bond Yield 2.30%
Current Coupon Fannie Mae TBA 102.93
Current Coupon Ginnie Mae TBA 103.81
30 Year Fixed Rate Mortgage 3.95

Stocks are lower this morning on overseas weakness. Bonds and MBS are flat. 

The advance estimate for second quarter GDP came in at 2.6%, in line with expectations. This is an increase from the first quarter estimate of 1.2%. Personal consumption increased 2.8%, while the price index increased 1% while the savings rate inched down. This should give the Fed the room to maintain interest rates at this level if they choose to do so.

The employment cost index rose 0.5% in the second quarter and is up 2.2% YOY. Wages and salaries increased 0.5% and benefit costs increased 0.6%. 

Consumer sentiment edged up in July, according to the University of Michigan survey. 

I had some questions yesterday regarding LIBOR and what happens to ARMs once it is gone in 2021? The short answer is that nobody knows for sure. The US will probably migrate to some other repo rate to set short term rates. Perhaps once LIBOR goes away, there will be a LIBOR reference rate which is pegged to whatever short term rate is being used and will move at a constant spread to that rate. 

I was discussing housing affordability a couple days ago and talked about mortgage payments as a function of income over time. I showed that the post bubble days hit 40 year lows (at least) and that we are still well below historical levels. The issue with that analysis is that it ignores the tax effects of the mortgage interest deduction, which really mattered in the late 70s / early 80s when tax rates and interest rates were much higher. Up until the mid 80s, the marginal tax rate for the median income was between 22% and 24%. It has been 15% ever since. Also, when interest rates were much higher, the vast majority of your payments for the first few years went to interest, not principal - in fact when mortgage rates were 17%, 99% of your first year's payment went to interest. Today, that number is much lower, and even ticked below 70% in 2012. Check out the chart below:


That chart also speaks to how much quicker one can build equity simply by paying their mortgage on time. Back in the 70s / 80s, you were probably lucky to have enough home price appreciation and principal paid to cover your closing costs if you moved after a few years. Today, you have both strong home price appreciation and a higher principal payment percentage. This helps emphasize how real estate is a great way to build wealth. 

Here is the chart comparing the gross percentage of income that a mortgage payment consumed over time and also the tax effected percentage: As you can see, it is pretty linear, and we are still in a great position now compared to 30 years ago. 


Friday, February 17, 2017

Morning Report: Home affordability returns to pre-crisis levels

Vital Statistics:

Last Change
S&P Futures  2338.5 -7.0
Eurostoxx Index 368.5 -1.6
Oil (WTI) 53.1 -0.3
US dollar index 910.9 0.1
10 Year Govt Bond Yield 2.41%
Current Coupon Fannie Mae TBA 102.1
Current Coupon Ginnie Mae TBA 103.2
30 Year Fixed Rate Mortgage 4.11

Stocks are lower this morning on overseas weakness. Bonds and MBS are up.

The index of leading economic indicators rose 0.6%, stronger than expected. 

Household debt increased in the fourth quarter, as growth in non-mortgage debt outpaced growth in mortgage debt. The 4th quarter saw $617 billion in newly originated mortgages, the highest level since Q32007. Auto loans and student loans saw an uptick in 90 day delinquencies, while credit cards and mortgages saw an improvement. Remember, this is only the debt side of the equation - both incomes and asset prices (especially housing) are higher than they were in 2007. 


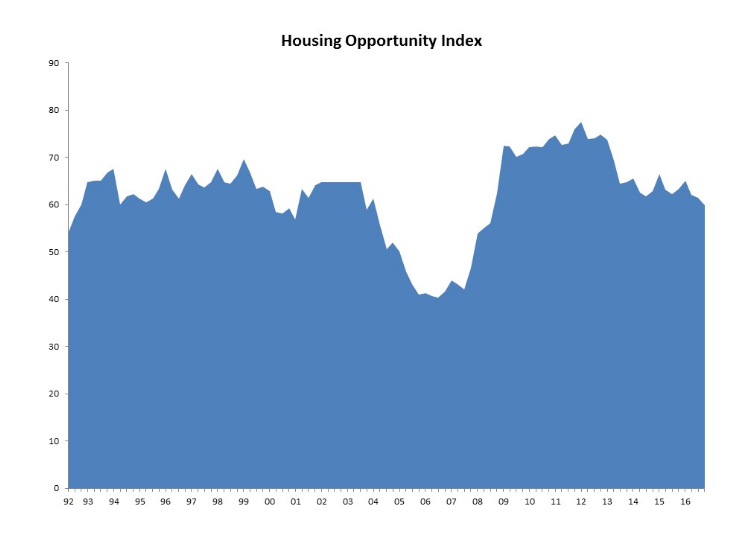
Housing affordability remains about in line with pre-crisis levels, according to the NAHB. As of the end of the year, approximately 59.9% of all homes were affordable to a borrower with the median income. You can see the big swing in affordability between the boom and bust years. Tight inventory is being offset by (still) low mortgage rates. California remains the biggest issue regarding affordability. In the San Francisco MSA, just 7.8% of the homes sold were affordable to people earning the median income of $104,700.  

The median home price increased 7% in January to $261,100, according to Redfin. Home sales were up 5.6% compared to January 2016, which shows that the uptick in rates hasn't affected the purchase market. Inventory is down 12% YOY, and listings have dropped 5.1%. 18% of homes sold above list price, and the average sales to list ratio was 93.7%. Days on market fell 7 days YOY to 59. 

Despite all the missteps of the initial days of the Trump administration, stocks are partying like it is 1999. This certainly has the political class (and the business press) scratching their heads. First, while the first 100 days of the Official U.S. Airing of The Grievances may seem dramatic, it doesn't mean much for business (except for some consumer product companies and retailers who suffer from ideologically-driven boycotts). Second, for all the talk in the business press of "uncertainty," investors are sensing (correctly, I think) that gridlock is going to rule the day in DC. Nothing is more "certain" than gridlock, and if regulations get eased a bit, that is good for business. Gridlock also means the Fed has some room to go slower. At the end of the day, earnings drive the stock market, not the histrionics in Washington and the media. 

Friday, February 19, 2016

Morning Report: inflation returning to the Fed's target

Vital Statistics:

Last Change Percent
S&P Futures  1910.0 -6.6 -0.34%
Eurostoxx Index 2867.6 -27.6 -0.95%
Oil (WTI) 30.09 -0.7 -2.21%
LIBOR 0.619 0.001 0.19%
US Dollar Index (DXY) 96.93 -0.019 -0.02%
10 Year Govt Bond Yield 1.77% 0.03%
Current Coupon Ginnie Mae TBA 105.3
Current Coupon Fannie Mae TBA 104.8
BankRate 30 Year Fixed Rate Mortgage 3.68

Markets are lower this morning on no real news. Bonds and MBS are down.

Real Average weekly earnings increased 1.2% in January.

Inflation at the consumer level was flat month-over-month and up 0.3% YOY. Ex food and energy, it was up 2.2%, which is the highest level since June of 2012. This would indicate the Fed is actually getting there as far as its inflation target. That said, the Fed prefers to use the Personal Consumption Expenditure index, which is still below their target.

Chart: YOY inflation, ex-food and energy:


Good explanation of why the markets and the price of oil have become positively correlated. Old timers might remember back when an increasing oil price was a bad thing. Punch line: the banks have a lot of exposure to the energy patch and are lugging debt that made sense at $60 a barrel, but not at $30. That said, energy companies have issued $5 billion in equity secondary offerings this year, which is a surprise. The appetite is there, at least for some investors. 

The thinking behind negative interest rates, explained. European economists give their take on it. Basically they work well in smaller. open economies as a lever to manipulate foreign exchange rates, but they aren't all that effective for larger economies which are trying to boost inflation and growth. In other words, they might work for Denmark, but probably won't do much good here. Japan recently went negative, so that will be a good test of that theory.

Housing affordability is getting a little better as rates fall. Unsurprisingly, the Rust Belt and the Northeast are the most affordable, while California remains the worst. Note San Francisco is proposing transfer taxes for luxury properties in order to address affordability. Between rich tech workers and Chinese investors, property prices in San Francisco are sky-high. 

There is legislation afoot to eliminate the caps on VA loans, which will make them much more popular in high cost areas. Basically it will become a no money down jumbo. It has passed the House, and the prospects are good in the Senate and the WH.