A place where economics, financial markets, and real estate intersect.
Showing posts with label unemployment. Show all posts

Monday, May 7, 2018

Morning Report: The US is at a Goldilocks moment with unemployment and inflation

Vital Statistics:

Last Change
S&P futures 2670 6.9
Eurostoxx index 388.46 1.44
Oil (WTI) 70.62 0.89
10 Year Government Bond Yield 2.94%
30 Year fixed rate mortgage 4.54%

Stocks are higher this morning as oil tops $70 a barrel. Bonds and MBS are flat.

Jobs report data dump:
  • Nonfarm payrolls 164,000 (lower than estimates)
  • Unemployment rate 3.9%
  • Average hourly earnings +.1% MOM / 2.6% YOY
  • Labor force participation rate 62.8%
This was the second month in a row where the labor force participation rate fell. The labor force fell by 236k, while the population increased by 175k. Wage inflation remains present, however it is still unlikely to drive higher inflation in the overall economy. The unemployment rate fell to the lowest since early 2000. This report takes some pressure off the bond market, and makes another run at 3% for the 10 year less likely. 


The drop in the unemployment rate along with moderate wage growth is somewhat of a Goldilocks moment for the Fed. The Philps Curve is an older economic model which suggests that inflation should rise as unemployment falls, which makes sense: Unemployment falls -> workers become scarce -> wages rise -> those costs get passed on to consumers. In reality, the relationship between unemployment and inflation has been weak (R^2 = .27). The low r-squared gives away the weakness of the model - it is too simplistic, plus the unemployment rate might not be the best measure of employment strength since it ignores the long term unemployed. However, if you look at the plot below, you can see we are at a very "Goldilocks" point, which is denoted by the yellow star.


The upcoming week will have the consumer price index and the producer price index, but that should be the only market-moving data. We will have some Fed-speak as well today and Wednesday. 

Donald Trump has until May 12 to renew the Iran deal. Israel calls the deal fatally flawed, while Iran says the US will regret not renewing it. West Texas Intermediate is trading over $70 on fears the deal will not be renewed. 

Doctors tend to have difficulties getting a mortgage early in their careers - they usually have a high level of student loan debt, no savings and the earnings early on can be low. Mortgages that carry a higher interest rate but don't require downpayments are becoming more popular for this market. These loans can carry an interest rate 25 -100 basis points over prevailing rates. although they usually don't require PMI. One catch - the prepay speeds on these mortgage will almost certainly be high. 

The CFPB dodged a bullet - PHH will not appeal the DC Circuit's ruling that rejected their claim that the single-director structure is unconstitutional. There are other cases in the process that also use that claim, so it is possible the question may come to SCOTUS. If one of these cases makes it to SCOTUS, the only one with standing to defend the agency is the Administration, who probably won't defend it.

Merger news: Mutual of Omaha is buying Synergy One. Synergy One will be a wholly-owned subsidiary and will continue to operate out of San Diego. 


Thursday, July 13, 2017

Morning Report: More Yellen testimony today

Vital Statistics:

Last Change
S&P Futures  2443.0 3.0
Eurostoxx Index 386.4 1.5
Oil (WTI) 45.5 0.0
US dollar index 87.9 -0.1
10 Year Govt Bond Yield 2.33%
Current Coupon Fannie Mae TBA 102.625
Current Coupon Ginnie Mae TBA 103.59
30 Year Fixed Rate Mortgage 4.03

Stocks are flattish as Janet Yellen begins her second day of testimony in front of Congress. Bonds and MBS are flat.

Initial Jobless Claims fell to 247k last week, showing that employers are hanging on to employees.

Inflation still remains in check at the wholesale level, as the producer price index rose only 0.1% in June. Ex-food and energy it rose 1.9% YOY, which is below the Fed's target. Services increased 0.3%, which could indicate wage growth is beginning to happen.

The markets rallied yesterday on Janet Yellen's dovish comments. Fed-Watcher Tim Duy believes the markets have it wrong. His view is that Yellen has spent enough time at the Fed to understand that the longer the Fed waits to address inflation, the more aggressive they will need to be, which increases the risk of a recession. He basically lays out four scenarios:
  • Inflation rebounds while unemployment remains steady, which is the base case Fed scenario
  • Inflation remains low while unemployment holds steady. This is the market's bet. 
  • Inflation rebounds while unemployment goes lower: This would mean a more aggressive Fed in 2018
  • Inflation remains low while unemployment goes lower: Difficult for the Fed.
His view is that we see one of the latter two scenarios. FWIW, I think the unemployment rate is a bit of a red herring given that the employment to population ratio is still pretty low. Granted, some of that is demographic (older Boomers retiring) and some of it is discouraged workers, but a 4.5% unemployment rate today doesn't really mean the same thing it meant, say, 20 years ago. I think the mistake people make is that they fail to recognize that recoveries after burst residential real estate bubbles are fundamentally different animals, characterized by low inflation, weak demand, and risk aversion in business. Weak demand and risk aversion are not recipes for inflation. I suspect the second or the fourth scenario is the most likely. IMO, we won't see inflation until we see wage growth, and that has been slow to materialize. 

Angel Oak Advisors priced a $210 million deal of non-prime residential mortgages recently, and it looks like the second quarter may break $1 billion in non-prime RMBS. This is a record since the financial crisis, but is still a shadow of its former self. At one point during the boom, 1/3 of all mortgages were alt-A or subprime. Even if we hit a record for the rest of the year, we probably won't even sniff 5%. In fact, many of the loans being put in these securitizations wouldn't have even been considered non-prime during the bubble years. These loans are non-QM, and mainly consist of two types of  borrowers: self-employed who don't have enough W2 income and borrowers with a credit event in the past who have large down payments. The borrowers in Angel Oak's portfolio are paying between 5% and 9%. 

Why do appraisals sometimes come in low?  Typically, the problem is in apples-to-oranges comps (i.e. not in the neighborhood, or comps that had an issue like asbestos, mold, etc). The other big issue surrounds things that have value, but tend to get short shrift with appraisers: things like a nice finished basement, a good view, nice appliances, etc. Raised ranch homes are often problematic, as the lower level gets completely excluded from the square footage, basically cutting your square footage in half. 

Friday, September 18, 2015

Morning Report: FOMC data dump

Vital Statistics:

Last Change Percent
S&P Futures  1949.8 -27.4 -1.39%
Eurostoxx Index 3155.6 -100.2 -3.08%
Oil (WTI) 45.32 -1.6 -3.37%
LIBOR 0.34 0.005 1.60%
US Dollar Index (DXY) 94.32 -0.311 -0.33%
10 Year Govt Bond Yield 2.15% -0.04%
Current Coupon Ginnie Mae TBA 104.4 0.1
Current Coupon Fannie Mae TBA 104.1 0.2
BankRate 30 Year Fixed Rate Mortgage 3.84

Stocks are getting crushed this morning after the FOMC decision to not raise rates. Bonds and MBS are rallying.

The index of leading economic indicators rose 0.1% in August.

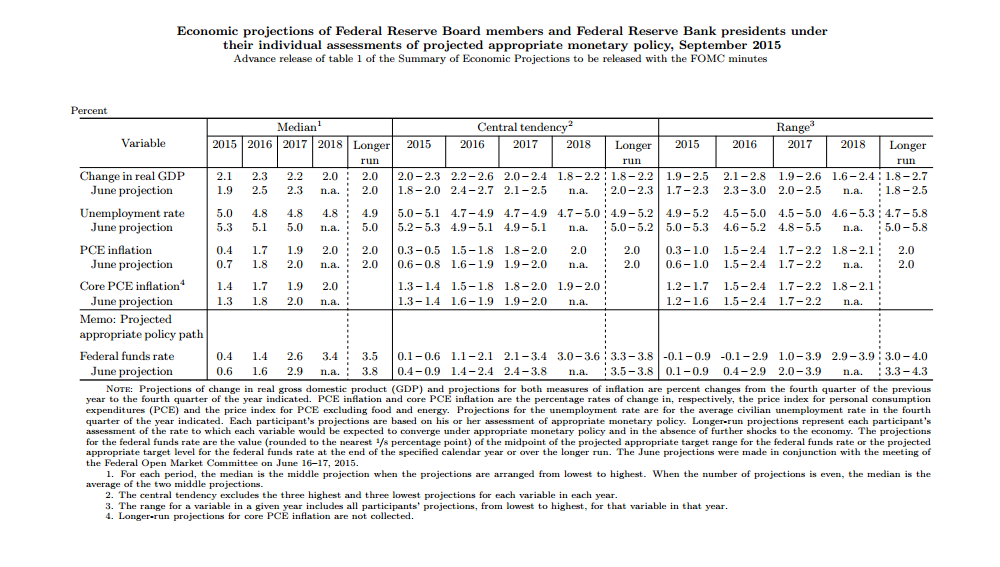
The Fed maintained rates yesterday, citing concerns over the global economy. Bonds rallied on the news while stocks rallied initially and then sold off. Even the statement was dovish. The new economic forecasts lowered GDP, unemployment, and inflation projections. The dot graph showed FOMC participants are forecasting lower interest rates through 2018 than they were in June. In fact, one participant thinks rates should be lower! Take a look at the dot graph below. Someone is predicting the Fed Funds rate should be negative this year and next. That is new. 


Here are the economic projections:


GDP is lowered, as is unemployment to below 5%. Note the Fed doesn't think it will hit its inflation target of 2% until 2018 (!). To me, this means the Fed is anticipating that the labor force participation rate is going to stay low - that is the only way to explain low unemployment and low GDP. They also seem to think that the overhang of these workers on the sidelines will be enough to keep wage inflation low. 

What does that mean for bonds and mortgage rates? If that forecast plays out, you could see short term rates increase and long term rates really not move all that much. To me it means a few more years of mortgage rates right around where they are now. This should be good for housing.


Wednesday, August 5, 2015

Morning Report: The paradox of the Millennials

Vital Statistics:

Last Change Percent
S&P Futures  2100.9 18.0 0.86%
Eurostoxx Index 3670.3 51.0 1.41%
Oil (WTI) 46.44 0.7 1.53%
LIBOR 0.304 -0.005 -1.59%
US Dollar Index (DXY) 97.81 -0.124 -0.13%
10 Year Govt Bond Yield 2.23% 0.01%
Current Coupon Ginnie Mae TBA 104 -0.5
Current Coupon Fannie Mae TBA 103.5 -0.5
BankRate 30 Year Fixed Rate Mortgage 3.88

Stocks are higher this morning as overseas markets rallied overnight. Bonds and MBS are down small.

Stocks got a boost when the ADP  Employment  Number came in weaker than expected. The ADP Employment number is often a decent forecast for the big payroll number on Friday. According to ADP, (the big payroll processing firm) the economy added 185k jobs last month, which was lower than the 215k forecast.  We  might be entering a "bad news is good news" cycle where weak economic news is considered bullish because it keeps the Fed on hold. 

FRB Atlanta President Dennis Lockhart said yesterday the economic data would have to deteriorate a lot to get him not to vote for a Sep hike. Lockhart's voice is important because he is considered more of a centrist. 

Mortgage Applications rose  4.7% last week, according to the MBA. Purchases rose 3.3% while refis rose 5.9%. 

Interesting take on the Millennial generation and the paradox of the labor market. How come, this far into the recovery, are Millennials still living at home with their parents? How is this possible with an unemployment rate of 5.3%? Historically, a 5.3% unemployment rate was associated with booming economies. This speaks to the disconnect between the data and what people actually perceive (and why, despite the data, people think we are still in a recession). According to the data, the labor market is strong, and those that put a lot of stock in that data believe that wage inflation is right around the corner, and therefore the Fed should start hiking rates. On the other hand, some point to the situation with the Millennial generation and say the data is, if not misleading, just not capturing the whole picture. They believe the underemployment rate (which is around 10.5% and represents people who have part-time jobs and want full-time jobs) is a better representation.


I would add, the quality off the full-time job matters. If a recent grad is working as a barista full time, they count as employed according to the Bureau of Labor Statistics. However, that grad should be working at an entry-level white collar job, which pays more than Starbucks. They aren't and that is why they are still living at home. 

Just for fun, I subtracted the unemployment rate from the underemployment rate to get a different picture on the economy. We are still at near recessionary levels, at least compared to past recoveries. Note the data only goes back to 1994. Still, an interesting chart:


IMO, that tells a different story. We are still at levels associated with the 91-92 recession, where recent grads were working in retail and unable to get jobs, This job market seems similar. It also speaks to the just-in-time labor management style companies use nowadays. Where does this leave the Fed? Well, the last time the spread was this high, the Fed waited another two years to start hiking rates. 

Friday, June 12, 2015

Morning Report - Bond bubble talk

Vital Statistics:

Last Change Percent
S&P Futures  2109.2 2.3 0.11%
Eurostoxx Index 3497.1 -54.8 -1.54%
Oil (WTI) 59.89 -0.9 -1.45%
LIBOR 0.288 0.002 0.82%
US Dollar Index (DXY) 95.28 0.181 0.19%
10 Year Govt Bond Yield 2.40% 0.02%  
Current Coupon Ginnie Mae TBA 100.8 -0.2
Current Coupon Fannie Mae TBA 99.29 -0.2
BankRate 30 Year Fixed Rate Mortgage 4.11

Stocks are lower as both the EU and Greece dig in their heels over a rescue package. Bonds and MBS are up small.

Inflation remains muted at the wholesale level. The Producer Price Index rose 0.5% in May, however that is energy driven. Ex food and energy, it was up 0.1%, or 0.6% year-over-year. The PPI is not that critical of an inflation index - the Fed uses the PCE deflator - but it shows that inflationary pressures remain contained. IMO we won't see any sort of inflation until we see wage gains, and we are only just starting to see that. 

Higher energy prices are not denting consumer sentiment according to the University of Michigan. June Consumer sentiment rose to 94.6 from 90.7 in May. 

A couple Fed researchers have crunched the numbers and believe that the natural rate of unemployment is about 4.3%, versus the 5.2% number the Fed currently uses. They focus on labor's share of income, which has fallen from 72.2% in 2001 to 62.9% now. If correct, that means the Fed has room to let the economy run. The bigger question is why the number has fallen so much. Is it weak bargaining power? Is it the fact that the emerging companies in the US need less employees? (For example, GE has a market cap of $276B and has 305,000 employees. Facebook has a market cap of $228B and has only 10,000 employees). IMO, it will come down to the labor force participation rate. Are the people who have involuntarily exited the labor force coming back? 


Cash sales make up 35% of all home sales, according to CoreLogic. That is down from the peak of 46.5% in Jan of 2011, but still well above the pre-crisis level of 25%. So for originators, this means more "gettable" business even if existing home sales don't improve all that much. I guess you can use cash sales as a proxy for distressed sales, and the places with the biggest foreclosure inventory and lowest price appreciation have the highest cash sales percent.


The raging debate in bond circles is whether we are in a bond bubble. Certainly sovereign debt yields are telling you that inflation is never, ever, ever coming back. However the bigger issue is corporate debt, which is being issued at a record pace as companies lock in low borrowing costs. If they were using that cash to build out capacity and invest in the business then there would be less concern. However, they are levering up to fund buybacks and M&A activity. That is a bigger issue. The biggest issue is that the holdings of corporate debt are now very, very concentrated in bond mutual funds, foreign investors and insurance companies. When there are bond fund redemptions, they have to sell. And new regulations regarding proprietary trading and bank capital mean that trading desks at the big investment banks are not going to absorb all that selling pressure. In addition, hedge funds are getting fewer and bigger as well. Corporate debt could get slammed hard if everyone heads for the exit all at once. Right now, the stock market is anticipating no problems when the Fed starts raising rates. That may end up being a bad bet. 


Friday, April 5, 2013

Morning Report - Dismal jobs report

Vital Statistics:

Last Change Percent
S&P Futures  1537.5 -17.0 -1.09%
Eurostoxx Index 2590.5 -30.9 -1.18%
Oil (WTI) 92.26 -1.0 -1.07%
LIBOR 0.279 -0.001 -0.36%
US Dollar Index (DXY) 82.43 -0.245 -0.30%
10 Year Govt Bond Yield 1.70% -0.06%  
Current Coupon Ginnie Mae TBA 105.8 0.5
Current Coupon Fannie Mae TBA 104.4 0.4
RPX Composite Real Estate Index 189.7 0.3
BankRate 30 Year Fixed Rate Mortgage 3.59

They're beating the tape with the ugly stick after a dismal jobs report. The S&P 500 futures dropped from -4 to -16 on the report. The 10-year jumped on the news and is now yielding 1.7%.  It is hard to believe the 10 year was above 2% three weeks ago. MBS are rallying as well, but not as much as the 10-year.

The March Employment Situation showed the economy added 88,000 jobs in March, well below the 190,000 estimate. February was revised upward to 268,000 from 236,000.  The unemployment rate ticked down to 7.6% from 7.7%, but that was due to a drop in the labor force participation rate, which dropped .2% from 63.5% to 63.3%. This means that the size of the labor pool dropped as more workers simply stopped looking for a job.  Long-term unemployed workers who are not actively looking for a job are not counted as part of the labor force. Wages were flat month-over-month and increased 2% year-over-year.

The recent rally in bonds pours cold water on the "great rotation" theory -  the idea that 2013 would be the year when investors, particularly big institutional investors, change their target asset allocation and sell bonds to buy equities. So far, it seems like that investors are allocating money equally to both sectors - stock funds have taken in $79 billion while taxable bond funds have taken in $76 billion. Between the Bank of Japan's QE program, which is driving funds to the US, the Fed's QE program, and continued investor purchases of bonds, the expected 2013 bloodbath in the bond market may be held off for a while. Meanwhile, mortgage bankers are licking their chops thinking about another refi wave.

Chart:  US Unemployment rate 1949-Present


Tuesday, March 12, 2013

Morning Report - NFIB Small Business Optimism

Vital Statistics:

Last Change Percent
S&P Futures  1548.6 -1.9 -0.12%
Eurostoxx Index 2715.7 -3.0 -0.11%
Oil (WTI) 92.49 0.4 0.47%
LIBOR 0.281 0.001 0.36%
US Dollar Index (DXY) 82.6 0.030 0.04%
10 Year Govt Bond Yield 2.04% -0.02%  
RPX Composite Real Estate Index 194.1 -0.1  

Markets are taking a breather after a string of gains over the past week and a half.  The Dow Jones Industrial Average is at a record high, and the S&P 500 is within striking distance of its 2007 high. Bonds are catching a bounce after a lousy week. MBS are up as well.

The National Federation of Independent Businesses reported that small business optimism increased small in February to 90.8, and is returning to its post crisis norm.  It is still well below its historical average, and even below the lows of the 91-92 recession and the 01-02 recession. The report makes an interesting study in contrasts - while the stock market indices are approaching record highs, and earnings are at or near record highs, the small business sector is still stuck in the morass that began in 2008.  The reason for that international sales account for a bigger percent of the S&P 500, and that has been doing better than the US (Europe notwithstanding). On the other hand, restaurants and retailers, the backbone of small business in the US, are still having a tough go of it as consumers continue to de-leverage. Construction, energy, and manufacturing were the bright spots of the report.


Given Friday's positive jobs report, how long will it take us to get to full employment? Of course it depends on the labor force participation rate.  The low labor force participation rate is what has been holding down the unemployment numbers, as people who have been unemployed over 6 months but are not actively looking for a job are no longer counted among the unemployed. If those people started looking for jobs again, they would start counting as unemployed and the unemployment percentage would increase.  If the labor force participation rate remains stuck at the current lows, it would take 49 months.  If it went back to historical norms, it would take 73 months.


With the continuing resolution approaching, Paul Ryan and Patty Murray will submit dueling budgets. Expect both budgets to be on the partisan side before real negotiating begins.  The sticking point will be the sequester, which the Left wants eliminated and the Right wants to use as the baseline for future budgets. The debt ceiling still needs to be dealt with at the end of the summer.

Mary Jo White promises to get tough on Wall Street if she is confirmed as head of the SEC. Finishing rulemaking under Dodd-Frank is an "immediate imperative" as well. High Frequency Trading will also be a focus. She is expected to be confirmed.

Monday, March 4, 2013

Morning Report - The new normal

Vital Statistics:

Last Change Percent
S&P Futures  1514.3 -2.2 -0.15%
Eurostoxx Index 2616.9 0.2 0.01%
Oil (WTI) 90.76 0.1 0.09%
LIBOR 0.283 -0.001 -0.35%
US Dollar Index (DXY) 82.31 -0.004 0.00%
10 Year Govt Bond Yield 1.84% 0.00%  
RPX Composite Real Estate Index 194.9 0.2  

Markets are slightly lower this morning after China imposed new measures to slow its housing bubble. There isn't much in the way of economic data this week with the exception of the jobs report, which was moved to this week.  Bonds and MBS are flat.

While the unemployment rate stays stubbornly in the high 7s, there are signs under the surface that things are getting better.  The median duration of joblessness fell to 16 weeks in January from 25 weeks in June 2010. American aged 45-55 experienced the biggest turnaround, and this would address one of the biggest achilles heels to the economy:  that many people in their prime earnings years are on the bench, which crimps spending.  Nobel Laureate Dale Mortensen views this as evidence that the US labor market will not enter hysteresis, or permanently higher joblessness, which happened in Europe in the 80s.

Is slower economic growth the "new normal?" There are a few explanations why the economic recovery has been so slow.  The first is simply bad luck. A series of exogenous events (the Euro crisis, crises in Washington, the Japanese tsunami) keep delivering blows to the economy just as it is getting going.  The second is the view of Kevin Warsh, which holds that bad policy decisions in the aftermath of the financial crisis - overregulation and a focus on short-term stimulus measures) have left the economy weakened.  The last is the view of the Keynsians, who argue that the stimulus was not enough, we need to do more, and as long as the bond market is willing to lend to us at sub 2% rates, we should borrow as much as we need to upgrade our infrastructure and hire millions of unemployed workers in the process.

FWIW, I believe that all of these explanations have a kernel of truth, but miss the big picture - that we are recovering from an asset bubble, and the de-leveraging that follows takes a long time to work through. When people borrow en masse to fund asset purchases, the debt remains even if the asset falls in value. That debt has to be dealt with, and someone has to eat the losses. While Washington would love to figure out a way to short-circuit this process, there isn't a good way to do it.  Much of the policy debate in Washington has centered over who should shoulder the costs, but you can't make them go away. And until they are dealt with, they will act as a drag on the economy.

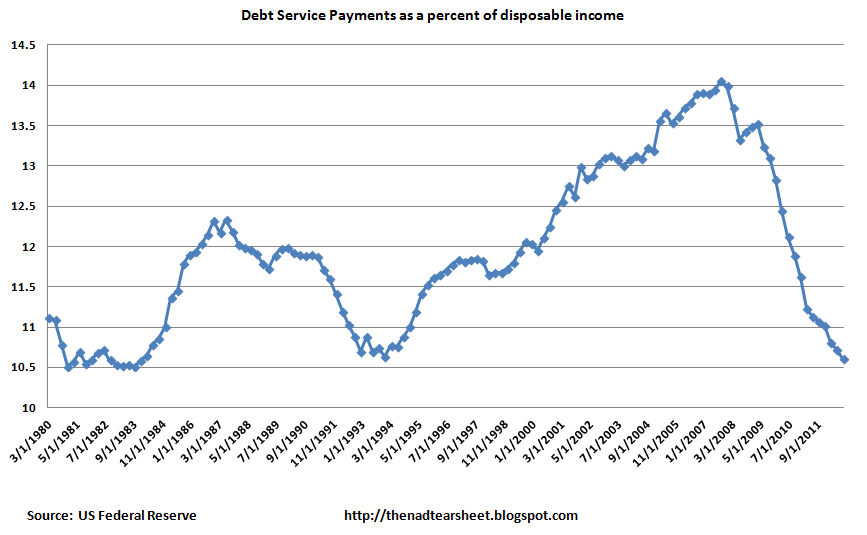
Luckily, corporate America is awash in cash.  They are done deleveraging.  The banks are still working their way through it, and no one really knows where they are marking some of their dodgier paper. Households are a mixed bag.  Debt service (the amount of principal and interest payments) is at multi-decade lows, however the total amount of debt is not. We have some ways to go here. The recovery will be made on two fronts - debt will be slowly paid down, while real estate prices will continue to rise.  And that is why the Fed is doing QE - to (officially) cut down debt service payments, and to (unofficially) help goose the real estate market.

Chart:  US Household debt as a percent of GDP:


Chart:  Debt Service Payments as a multiple of disposable income


But ZIRP and QE isn't "free." Unintended consequence of ZIRP # 547,624 - a bubble in student loan paper. Sallie Mae just sold $1.1 billion of securities backed by private student loans (in other words, not backed by the Federal Government) and the riskiest tranches were 15x oversubscribed. This year alone, dealers sold $5.6 billion of student loan backed securities, with an average yield of 1.48%.  And we have only issued about a billion dollars worth of jumbo securitizations since the bubble burst?  I find it absolutely amazing that we can securitize unsecured loans made to students majoring in underwater basket weaving, but we can't securitize a stated income loan. Is it Dodd-Frank and its open questions regarding "skin in the game" for issuers?  If it is, I suspect the private label market will come back in a hurry once the regulators figure out what they want to do.

Friday, February 1, 2013

Morning Report - Jobs Day

Vital Statistics:

Last Change Percent
S&P Futures  1501.6 8.3 0.56%
Eurostoxx Index 2707.2 4.2 0.16%
Oil (WTI) 97.39 -0.1 -0.10%
LIBOR 0.296 -0.003 -0.84%
US Dollar Index (DXY) 79.06 -0.144 -0.18%
10 Year Govt Bond Yield 1.99% 0.01%  
RPX Composite Real Estate Index 193.1 -0.2  

Futures are higher this morning after Jan payroll data.  157k jobs were added in January and the unemployment rate ticked up .1% to 7.9%.  Separately, there is a slew of economic data this morning. The University of Michigan consumer confidence rose to 73.8, construction spending rose .9% in Dec, and the ISM manufacturing survey rose to 53.1 from 50.7, a big upside surprise.  Both bonds and stock have found something to like in the data and are rallying.

The internals of the job report show that construction employment has been accelerating during what should be a seasonally slow period.  Weekly hours dropped. The labor force participation rate was unchanged at 63.6%. The BLS also made some revisions and adjustments to the historical numbers, which had the effect of increasing job creation during the past year and increasing the size of the labor force. It also means that some historical comparisons are not "apples to apples." The market is focusing on the 7.9% unemployment number because that is what is driving the Fed at the moment. Overall, it was a mixed report, showing the labor market is improving, albeit slowly.

Chart:  US Unemployment Rate:


St Louis Fed President James Bullard says that unemployment in the "low 7s" could cause the Fed to end QE. 

Lender Processing Services has put out its January Mortgage Monitor. They show that foreclosure sales are at the lowest level since March of 2009, although starts are beginning to tick up again. Speaking of foreclosures, CoreLogic reported 56,000 foreclosures in November (a 3% YOY drop).  Pre-bubble run rates are closer to 21k.  Approximately 1.2 million homes were in the national foreclosure inventory at the end of 2012, which is a 20% decrease from the prior year. 

As home prices increase, more and more previously underwater homeowners are becoming eligible to refinance - LPS estimates the number could be 4 million.  Which means that in spite of rising interest rates, the refi boom may still have some legs.

Is cheap energy the answer to the problem of offshoring?  Nucor is building a new plant in Louisiana, after sending production to Trinidad.  The reason?  Cheap natural gas as a result of fracking.  Will it make much of a dent in unemployment?  Probably not, as it will only employ 150 people who will make on average $75k. Manufacturing is increasingly hiring highly paid skilled workers and not the unskilled. That said, the oil and gas industry does have a need for unskilled labor. 

Bill Gross says the rise in unemployment is giving the bond market a "period of rest", meaning there is room for a bond market rally. He is recommending the 5 year and is avoiding duration as he believes that QE has made the bond market "bubbly." It will be interesting to see what the bursting of that bubble will do to the economy.