| Last | Change | Percent | |
| S&P Futures | 1307.5 | 6.2 | 0.48% |
| Eurostoxx Index | 2155.6 | 8.7 | 0.40% |
| Oil (WTI) | 92.68 | 0.1 | 0.13% |
| LIBOR | 0.467 | 0.000 | 0.00% |
| US Dollar Index (DXY) | 81.38 | -0.004 | 0.00% |
| 10 Year Govt Bond Yield | 1.72% | 0.02% | |
| RPX Composite Real Estate Index | 175.6 | 0.1 |
Markets are firmer this morning after enduring a bloody week which sent the S&P down 3.6% and the 10 year government bond yield down to 1.69%. Today is also the expiration of May options, so there is always the potential for funny closing prints. There is no economic data being released this morning. Bonds and MBS are down slightly.
It's Facebook Day! Facebook priced at the top end of the revised range last night and should begin trading around 11:00. There are a stocks that capture the attention of the populace and Facebook is one of them. Growth fund managers who have been starving for a good growth story besides Chipotle Mexican Grill and Lululemon just got a new one. With an IPO price at 28x revenue, the stock will have to almost collapse to get value and GARP guys interested. I'm sure if you are a good technical trader, you should be able to have a field day with this one. Treat it as a slip of paper with an alphanumeric code, not an investment, cause it isn't.
Bloomberg has a column on why principal reductions won't solve the housing crisis. The big problem is that something like 80% of all underwater homeowners with Fan and Fred mortgages are current on their mortgages. Any principal reduction program will encourage people to stop paying their mortgage. Second, of those seriously delinquent, most of them won't be able to afford the lower payment anyway.
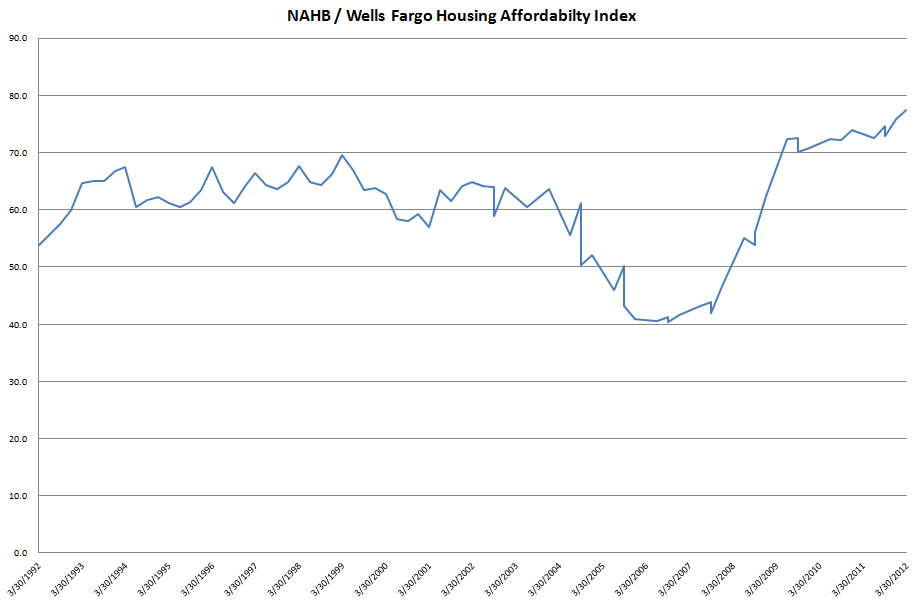
The National Association of Home Builders and Wells Fargo have constructed a housing affordability index, which is a measure of the percent of homes affordable by someone at the median income. The latest index is 77.5, which means 77.5 percent of all new and existing homes sold in Q1 were affordable for families earning the national median income. In a lot of ways, this chart is the inverse of my median house price to median income chart.
Chart: NAHB / Wells Fargo Housing Affordability Index:
No comments:
Post a Comment