A place where economics, financial markets, and real estate intersect.
Showing posts with label Case-Shiller. Show all posts

Tuesday, August 28, 2018

Morning Report: The Fed worries about the yield curve

Vital Statistics:

       Last     Change
S&P futures29033
Eurostoxx index386.36.8
Oil (WTI)68.910.02
10 Year Government Bond Yield2.87%
30 Year Fixed rate mortgage                              4.58%

Stocks are higher this morning on optimism over trade talks with Mexico. Bonds and MBS are down. 

We saw a strong buildup of inventory in July, both at the retail level and the wholesale level. Inventory growth was negative in the second quarter, which depressed GDP growth slightly. This improvement in inventories will provide a boost to the third quarter numbers. Durable goods and autos led the increase, with retail inventories up 0.4% and wholesale inventories up 0.7%. 

Redbook reported that same store sales rose 5.1% last week, which was the third fastest pace this year. This bodes well for the back-to-school numbers which are the best predictors of the holiday shopping season. Consumption has been generally strong and these numbers bear that out.

Consumer confidence jumped to 133.4 in August according to the Conference Board. This is the highest level since late 2000. 

House prices rose 6.2% in June, according to the Case-Shiller home price index.  Las Vegas, San Francisco, and Seattle reported double-digit increases. The laggards included New York, Chicago and Washington DC which reported low single-digit gains. Las Vegas is one of the fastest growing US cities in terms of population and employment growth, which explains the rise there. Seattle and San Francisco has restricted supply along with foreign demand. On the other side, the Northeast continues to stagnate. 

The Urban Institute looked at mortgage denial rates along demographic lines and found that most of the studies that report discrimination overstate denial rates because they fail to take into account incomes and credit scores. While they still found some evidence of racial disparity it is much lower when you correct for these things. Not sure if the difference is statistically significant though. Given that CRA loans are worth more than traditional loans (all things being equal) it is surprising that there is any difference at all. 

As the long end of the curve continues to rally, we will have a steady diet of recession prediction stories in the business press. The latest Reuters story cites a Federal Reserve study that suggests the market may be warning of a potential recession: “In light of the evidence on its predictive power for recessions, the recent evolution of the yield curve suggests that recession risk might be rising,” wrote San Francisco Fed research advisers Michael Bauer and Thomas Mertens. 

The flattening yield curve provides plenty of fodder for the Wall of Worry, however there are a couple of things to bear in mind. First, the yield curve almost always flattens during a tightening cycle. Take a look at the chart below, and you can see the yield curve flatten as short term rates rise. 


The behavior of the yield curve is 100% normal. Not only that, longer term interest rates are being held artificially low due to the behavior of central bankers throughout the world. The Fed is still buying Treasuries, albeit at a slower pace, while Japanese and European central bankers are pushing down long-term rates, which influences US rates. The signal-to-noise ratio of the yield curve is extremely low right now. Finally, the short Treasury trade is probably the biggest macro bet on the Street right now. Every wiseguy is short, and that means you will sometimes get these rallies for no apparent reason. 

Tuesday, July 31, 2018

Morning Report: Strong growth in spending and incomes

Vital Statistics:

Last Change
S&P futures 2811 7.75
Eurostoxx index 391.64 0.72
Oil (WTI) 69.72 -0.41
10 Year Government Bond Yield 2.95%
30 Year fixed rate mortgage 4.62%

Stocks are higher as earnings continue to come in. Bonds and MBS are up on news that the Bank of Japan will continue to hold down rates. 

Personal spending and personal income rose 0.4% in June, according to BEA. Inflation remains under control with the PCE price index up 2.2% YOY and the core rate up 1.9%. The income and spending numbers were in line with expectations, and the inflation numbers were a touch below. Good news for the bond market as we start the FOMC meeting. Separately, another strong number out of the Chicago PMI. 


Punch line: wages and salaries up 2.9%, inflation up 2.2% - we are seeing real wage growth despite all the stories in the press that wages are stagnant. 

Home prices rose 6.4% in May according to the Case-Shiller home price index. San Francisco, Seattle and Las Vegas all reported double-digit gains. All MSAs are beginning to correlate a little tighter, with the spread between fastest and smallest falling to 10 percentage points, which is much smaller than the 25 ppts we saw during the bust years and the 20 ppt average since 2001. My guess is that this is a function of the improving job market in the Midwest and working through the last of the foreclosure inventory in the Northeast.

Mission creep out of the GSEs? Some Republican congressmen are calling foul as Fannie and Fred started a pilot program where they buy low downpayment loans and pair them with MI from Arch. Many in Congress would like to see Fannie and Freddie reduce their footprint in the mortgage market, not increase it. The FHFA has justified this move as necessary to perform their affordable housing mission. This will be a constant partisan battle, between Republicans who are alarmed by the fact that the US taxpayer bears the majority of the credit risk in the US mortgage markets and Democrats who are alarmed by the lack of affordable housing.  

Young people are shunning construction jobs. The share of younger (under 24) workers in the construction industry has fallen 30% since the bubble days. The number of workers in the industry has fallen as well - from 11.7 million in 2006 to 10.2 million 10 years later. The typical construction job stays open for 39 days nationally, and many builders are hiring ex-cons to meet demand. The obvious answer would be for builders to raise pay to attract people, but what do you do if you are in the starter home business? Between higher wages and regulatory costs, your starter home might be unaffordable to people with the starter income. Note the industry has promised to train 50,000 workers over the next 5 years, but this is a drop in the bucket. 

Tuesday, June 26, 2018

Morning Report: Case-Shiller continues to move higher

Vital Statistics:

Last Change
S&P futures 2724 1.5
Eurostoxx index 378.31 1.12
Oil (WTI) 68.22 0.14
10 Year Government Bond Yield 2.88%
30 Year fixed rate mortgage 4.57%

Stocks are flattish this morning on no real news. Bonds and MBS are up. 

Consumer confidence slipped in June, according to the Conference Board. The decline, while still high by historical standards, was driven more by a drop in the outlook than it was by a decline in current conditions. 

Home price appreciation continued in April, with some real eye-popping moves in a few MSAs. Seattle and Las Vegas were up 13%, YOY, San Francisco was up 11%. Bringing up the rear was Chicago and Washington, up 3%. While the index has hit its 2006 peak, it is important to remember these are nominal (i.e non-inflation adjusted) numbers. If you adjust for inflation, Dallas, Denver and Seattle have regained their bubble peaks, while everyone else is still lower. Inventory is still tight, but the picture is improving. 


Housing demand was up 7% in May, according to Redfin. Redfin measures housing demand by counting the number of offers and requests for home tours. Demand is actually down from a year ago, but the market is still a seller's market. 

Fears of a trade war are causing big asset allocations into government bonds. The government bond ETF GOVT saw record volume on Friday of $600 million. Momentum traders are beginning to pile into the long Treasury trade. Morgan Stanley is calling the top in yields. “While trade tensions have yet to negatively impact U.S. economic data noticeably, the Fed has started to hear more concern from business contacts. We see risk that such tension will impact economic data more in the coming months, even if a benign outcome comes to pass eventually.” FWIW, the Fed Funds futures are still handicapping a toss-up between 1 or 2 more hikes this year. 

For mortgage originators, trade fears are probably going to help keep the 10 year below 3%, though it probably won't be enough to bring back refi volume or to save the year.

Speaking of saving the year, in the second quarter cost cutting was a #1 or #2 concern for 30% of all mortgage originators. Last year, only 11% saw cost cutting as a #1 or #2 concern, focusing more on consumer-facing technology and process streamlining. In the first quarter, mortgage bankers reported a loss on production for only the second time in 10 years. 


Tuesday, May 29, 2018

Morning Report: Markets cool on a June hike after Italian elections

Vital Statistics:

Last Change
S&P futures 2700 -18
Eurostoxx index 384.87 -4.95
Oil (WTI) 66.97 -0.91
10 Year Government Bond Yield 2.87%
30 Year fixed rate mortgage 4.54%

Stocks are lower this morning as Italian sovereign debt is getting slammed on the election results. Bonds and MBS are up on the flight to quality.

Over the weekend, Italy failed to establish a coalition of Eurosceptics and their president rejected a Eurosceptic finance minister. The fact that Italy came so close to electing a government that would consider exiting the EU has bond traders selling Italian sovereigns. Between this and Brexit, many observers are wondering if the whole EU experiment is beginning to unravel. How much of this is merely symbolic remains to be seen, but in the meantime the flight to quality trade is on, and that means lower rates. 

Italian 10 year bonds are trading at 3.16%, which is up 143 basis points over the past several days. Spain is wider as well, while the rest of the Eurozone (Germany, France) is tighter. The canary in the coal mine for rates however will be the Eurozone banks, and cost of credit protection is going up. Unicredit and San Paolo Imi are up almost 100 basis points, Deutsche Bank (which has other non-Italian headaches) is up 40, and most other Euro banks are up modestly. As of now, this is mainly a European bank phenomenon, however Citi is also up small.  

US yields are lower across the board, from the 2 year to the 30 year. Convexity buying will probably give the move legs at least for the near term. The Fed Funds futures are now handicapping a 78% chance for a hike at the upcoming meeting. It was at 95% a week ago. If the Italian debt problem gathers momentum, it will inevitably cause financial stress to rise and that will give the Fed an excuse to sit the next meeting out. As long as inflation is behaving, they can afford this luxury. Falling oil prices are helping as well.


The Italian vote will probably be sometime this fall, so it at least appears as there won't be an immediate resolution. Bottom line for the mortgage originators, like the Brits did in 2016, the Italians just might have saved your year.

Aside from Italy, we have a lot of data this week, with GDP on Wednesday, personal income / spending on Thursday, and the jobs report on Friday. European newsflow will be the dominant force, however any sort of weakness in the numbers will probably have an outsized impact as the Street is really leaning the wrong way here.

Home prices increased 6.5% YOY in March, according to the Case-Shiller Home Price Index. Seattle, San Francisco, and Las Vegas all posted double-digit increases, while Chicago and Washington DC brought up the rear.

Consumer confidence increased in May, according to the Conference Board. The Present Situation component increased more than the Expectations component. This is surprising given that these consumer confidence indices are often an inverse gasoline price index.

6 trends from the MBA Secondary conference last week: The main points are that margins are falling and volumes are shrinking. Many independent originators are not going to make it through the year. JP Morgan may increase it footprint in FHA after the regulators loosened the thumbscrews. Ginnie Mae will issue a report this summer talking about the future of digital mortgages for the industry. The GSEs are looking to implement technology to allow originators to sell off servicing rights easier, and there remains a need for ways to increase the credit box for the first time homebuyer, who is still often shut out of the market.

Speaking of the first time homeuyer, they decreased activity in the first quarter, according to Freddie Mac. Homes purchased by first time homebuyers slipped by 2% to 411,000. 81% of first time homebuyers used low down-payment mortgages.

First time homebuyers are going to struggle to compete with all-cash buyers. Now, a new startup intends to disrupt homebuying by allowing borrowers who need a mortgage to offer cash instead to the seller (essentially the startup bears the risk if the borrower somehow can't get a mortgage). “We’re taking that single value proposition that a lot of these institutions and iBuyers have, which is access to capital, and we’re democratizing that capital for the benefit of consumers instead of using it for corporate profits,” said Ribbon CEO Shaival Shah. “Cash discounts that consumers earn from our program flow directly back to the consumer. Based on our early deal volume, customers are seeing an average of 5 percent savings to the purchase price by using Ribbon.” The startup is backed by Bain Capital and a few others.

Interesting perspective in the "robots are going to take our jobs" scare. Historically, improvements in farming, technology, industry have caused jobs to disappear. Obama Administration economist Austan Goolsbee argues that if robots and AI increase productivity (meaning we get more output from less input) that makes us richer. The question for jobs is inevitably how fast the adjustment process happens. The longer it takes, the easier the transition. The paper reads quite easily for an academic paper and provides some needed perspective.

Again, on a personal note, I am still looking for a senior capital markets / securities analyst position so if anyone has any leads, please let me know. 

Tuesday, April 24, 2018

Vital Statistics:

Last Change
S&P futures 2682 10.5
Eurostoxx index 383.28 0.1
Oil (WTI) 68.68 0.01
10 Year Government Bond Yield 2.99%
30 Year fixed rate mortgage 4.56%

Stocks are up this morning on strong earnings by Caterpillar. Bonds and MBS are down. 

New Home Sales rose 4% MOM and 8.8% YOY to an annualized pace of 694,000 in March. The median sales price was$337,200 and the inventory of 301,000 represented about 5 month's worth. The number was well above Street estimates, however the confidence interval for this estimate is invariably wide. 

Consumer Confidence improved to 128.8 in April as tax cuts have pushed sentiment to post-recession highs. 

Home price appreciation is accelerating, with the Case-Shiller Home Price index up 6.8% YOY. We saw double-digit annual increases in San Francisco, Seattle, and Las Vegas. 

The FHFA House Price Index reported a bigger increase - 7.2% YOY. The FHFA index only covers conventional loans, so it is a narrower index than Case - Shiller. The increases ranged from 4.8% in the Middle Atlantic to 10.3% in the Pacific.


What is the issue with the lack of home construction? Lack of labor. The construction industry has about 250,000 unfilled jobs right now, according to the NAHB. At the peak of the bubble, there were about 5 million people in construction; today that number is closer to 3.8 million. Many of these workers found employment in other industries (especially energy extraction) and aren't about to go back. Immigration restrictions are another headache, as the government estimates that 13% of the construction workforce is working illegally. Finally, the opiod epidemic is particularly problematic in an industry where people are likely to be injured on the job and in pain generally. Ultimately, wages will have to increase to the point to lure a new generation of construction workers out of their climate controlled offices. 

Round numbers always bring out the strategists, and as the 10 year sits close to the 3% level, we are seeing pieces discussing the asset allocation implications. Since the financial crisis, the earnings yield on the S&P 500 has been higher than the 10 year, although the premium is at the lowest level since 2010. One strategist thinks the 1950s are a good analogy for investors, where interest rates gradually rose as the memories of the Great Depression faded and the economy was strong. As an aside, Jim Grant discusses how the big retail investor trade in the 1950s was the leveraged curve flattener, where people would borrow short term money to invest in long-term Treasuries. That trade worked until the bond market crashed in the late 50s and a lot of people got carried out. 

Is demand falling for houses? According to Redfin's Housing Demand Index it is. “Abnormally late winter weather and an early Easter likely delayed homeowners planning to list their homes for sale in March,” said Redfin chief economist Nela Richardson. “While inventory levels are still not nearly high enough to meet strong buyer demand, we do expect new listings to pick up in April and May.”

The House has introduced legislation to end regulation by enforcement by the CFPB. HR 5534 would require the CFPB to provide guidance on its regulations and to establish a framework for monetary penalties. 

Tuesday, February 27, 2018

Morning Report: Jerome Powell Addresses Congress

Vital Statistics:

Last Change
S&P Futures  2782.0 -2.5
Eurostoxx Index 381.8 -1.3
Oil (WTI) 63.6 -0.3
US dollar index 83.7 0.2
10 Year Govt Bond Yield 2.88%
Current Coupon Fannie Mae TBA 102.313
Current Coupon Ginnie Mae TBA 102.531
30 Year Fixed Rate Mortgage 4.4

Stocks are down small on no real news. Bonds and MBS are down as well.

Durable Goods Orders fell 3.7% in January MOM, but rose 6.8% YOY. Ex-transportation, they fell 0.3% MOM and rose 6.9% YOY. Core Capital Goods (a proxy for business capital expenditures and expansion) fell 0.2% MOM and is up 6.3% YOY. 

In other economic news, the trade deficit widened to 74 billion, while retail inventories rose 0.8%. Wholesale Inventories rose 0.7%.

Home prices rose 6.3% YOY in December to close out 2017 up 6.3% overall. House price inflation will be subject to a bit of a push-pull effect: Strong demand and limited supply will provide support for home prices, while increasing interest rates will reduce affordability and should have a dampening effect on home price inflation. That said, by historical standards, these mortgage rates are still extremely low, and affordability is still extremely high, at least on a long-term basis when you use monthly payment as a percentage of income. 

The FHFA House Price Index rose 0.3% and it is up 6.5% for the year. 

Fed Chairman Jerome Powell testifies in front of Congress this morning at 10:00 am. Here are his prepared remarks. Nothing in the remarks jumps out at me as anything all that new, although Powell argues that the stability of the labor force participation rate over the past few years is a sign of strength, not weakness. Yes, baby boomers are retiring but their kids are entering the workforce so it should balance out. Below is a chart of the labor force participation rate going back to WWII. Note the steady rise beginning in the 1960s. That is the baby boom entering the workforce, and the secular change of more women entering the workforce. About half of those gains have been given back in the Great Recession. I think he is saying that the labor force participation rate should be trending even lower due to demographic factors, and that the stability of the past few years is evidence that the labor market is strong. Perhaps. 


The Fed has always had a simple model of unemployment and inflation called the Phillips Curve. It basically says that unemployment will start driving inflation if it gets low enough. Historically economists have thought that unemployment levels in the low 4s would trigger it. So far we have seen some wage inflation in some skilled areas, but nothing widespread. Most of the inflation we have been seeing has been commodity push inflation driven by food and energy prices. These things often reverse, as higher prices invite new supply. Or in other words, the cure for high prices is high prices. 

You are beginning to see a new theory in academia - that the slow growth in wages is not due to a supply / demand issue, but is evidence of an antitrust problem, or at least a market failure. Hard to see how heavyweights like Wal Mart and McDonalds are colluding for low wage labor, but that;s what they believe, and they think the cure is a higher minimum wage, more unions, and exerting more oversight over the bigger employers. Occam's Razor says that labor-replacing technology is probably the driver, but that's no fun. 

Toll Brothers reported better-than expected earnings this morning, showing that there is still plenty of strength in the luxury sector of the market. Orders rose 19% in units, and ASPs rose 6.8% to $826k.  Margins are falling however, as increasing input and labor costs push against price hikes. 

Surprising stat: 35% of homebuyers bid on a home before seeing it in person. The young buyer is more likely to do this: almost half of Millennial buyers bid before seeing. 

Tuesday, July 25, 2017

Morning Report: House prices hit new highs. Are we in a bubble?

Vital Statistics:

Last Change
S&P Futures  2475.0 7.0
Eurostoxx Index 381.8 2.5
Oil (WTI) 47.2 0.9
US dollar index 86.4 -0.1
10 Year Govt Bond Yield 2.28%
Current Coupon Fannie Mae TBA 102.93
Current Coupon Ginnie Mae TBA 103.81
30 Year Fixed Rate Mortgage 3.95

Stocks are higher this morning as the Fed begins their 2 day FOMC meeting. Bonds and MBS are down. 

House prices rose 0.4% MOM in May, according to the FHFA House Price Index. They are up 6.9% YOY. Home price appreciation is still red-hot on the West Coast, however some of the laggards (Midwest and East Coast) are starting to pick up steam. Meanwhile, the Case-Shiller Home Price Index rose .1% in May and is up 5.7% YOY. Why the difference? The FHFA House Price index only looks at homes with a conforming mortgage, which eliminates the distressed all-cash extremes on the low end, and jumbos on the high end. Certainly out here in the Northeast, the luxury end of the market (aside from trophy properties in the Hamptons and Manhattan) is deader than Elvis. Note that we have more than recouped the losses from the go-go days, at least according to the FHFA House Price Index.


I wanted to spend a little more time discussing housing affordability. If you look at the median house price to median income ratio, we are approaching the highs during the bubble years. We are currently at around 4.4x and historically, that number has been between 3.2 and 3.6x, meaning that house prices are stretched compared to incomes. It makes sense that house prices should be related to incomes in terms of measuring affordability, and also vulnerability do downdrafts. 


However is "median house price" the correct metric to use when determining affordability? It has one major flaw: it ignores interest rates. As car dealerships know, the sticker price is not the metric to sell a car: it is the monthly payment. Can't afford a 30,000 car? Well, what if we go from a 6 year loan to an 8 year loan? Can you now afford that payment? Mortgages aren't really that much different. So, to look at it from that angle, I plotted the typical mortgage payment (80 LTV conforming loan) on the median house and calculated what percentage of median income that payment turned out to be. And when you look at it that way, affordability it still pretty decent, at least compared to historical numbers. The reason why? Interest rates. For almost a decade, mortgage rates were double digits, and that equates to a much bigger payment for the same "median house." It turns out that mortgage payments as a percentage of income are much lower than what they historically have been. 


Now, the one complicating factor is the mortgage interest deduction, which makes housing in the 80s look less affordable than it really was. Taxes were higher, and interest as a percentage of the P&I payment was higher, so the differences are somewhat exaggerated. However, it does appear that buying a house is not as "unaffordable" as the median house price to median income ratio implies. Just remember these graphs when you hear people discussing how high real estate prices are and that we are in another bubble. We aren't. 

Tuesday, June 27, 2017

Morning Report: Seattle home prices rise 13%

Vital Statistics:

Last Change
S&P Futures  2433.8 -2.3
Eurostoxx Index 386.3 -2.7
Oil (WTI) 44.0 0.6
US dollar index 88.4 -0.3
10 Year Govt Bond Yield 2.17%
Current Coupon Fannie Mae TBA 103.31
Current Coupon Ginnie Mae TBA 104.375
30 Year Fixed Rate Mortgage 3.91

Stocks and bonds are lower this morning as we have a lot of central bankers speaking today. 

Home prices rose .5% in April and are up 5.7% YOY, according to the Case-Shiller Home Price Index. Seattle home prices rose almost 13%, while Portland and Dallas rose over 9%. They ask the question whether we are in another bubble, which we are not. Bubbles are fundamentally psychological phenomenons, where both investors and lenders view an asset as "special" and argue that it cannot fall in price. While home prices may be reaching unsustainable levels, the lending side of the business is emphatically not exhibiting bubble-like behavior. Credit is still tight for anything that doesn't fit in the government / GSE box. In fact, the government would like lenders to take more risk than they are willing to take at the moment. 

Consumer confidence rose in June, while the Richmond Fed Manufacturing index improved. 

Fannie Mae's latest Housing Outlook is out, and they are predicting 2% GDP growth for 2017. For Q2, they are forecasting 2.9%. Housing will continue to be held back by labor and land shortages, however mortgage rates will remain supportive of the housing market in general. 

Senators Bob Corker and Mark Warner are working on a plan to break the Fannie / Freddie duopoly. The plan would split the single-family and multi-family lines and break the single family up into more independent firms. The broad guidelines are to increase competition, reduce barriers to entry, reduce risk to the taxpayer, and to maintain the 30 year fixed rate mortgage. The most difficult part will be dealing with low-to-moderate income support, where there are genuine philosophical differences between Republicans and Democrats. 

The bloom is off the rose for the post-election surge in confidence, according to Gallup. The economic confidence index stayed at 3 last week, off of its March high of 15, but still above the pre-election level of -11. Much of this breaks down along partisan lines, with Democratic voters the most gloomy about the economy and Republican voters most confident. Before the election, this dynamic was reversed - with Democrats optimistic and Republicans pessimistic. 


Tuesday, January 31, 2017

Morning Report: Wages and salaries up 2.3% YOY

Vital Statistics:

Last Change
S&P Futures  2270.3 -5.8
Eurostoxx Index 362.9 0.3
Oil (WTI) 53.0 0.3
US dollar index 90.8 -0.3
10 Year Govt Bond Yield 2.48%
Current Coupon Fannie Mae TBA 102.1
Current Coupon Ginnie Mae TBA 103.2
30 Year Fixed Rate Mortgage 4.16

Stocks are lower as earnings come in (and some are bad). Bonds and MBS are up small.

Employment costs increased 0.5% in the fourth quarter as wages and salaries increased 0.5% and benefit costs increased 0.4%. On a year-over-year basis, wages and salaries are up 2.3%, an uptick from the 2.1% pace a year ago. This report is more or less in line with expectations and shouldn't have much of an effect on the FOMC's rate decision. The meeting starts today, with an announcement scheduled for 2:00 pm EST tomorrow.  FWIW, the Fed Funds futures are pricing in a 13% chance of a rate hike tomorrow, and a 50% chance of a hike by June. 

Home prices increased 5.6% YOY in November, according to the Case-Shiller Home Price Index. This index has recouped all of its losses from the bubble years. The Pacific Northwest led the charge, with prices increasing double digits in Portland and Seattle. Washington DC and NYC were the laggards. 

Here is the income required to buy the median home in various locations. It varies from almost $150k in San Francisco to $34k in Cincinnati. As they say, all real estate is local. 

Donald Trump promised to "do a big number" on Dodd-Frank yesterday. While the President is limited in what he can do unilaterally, he can ease the burden somewhat without legislation. 

One economic historian thinks the current bond market most closely resembles the late 1960s, as we exited a multi-decade period of low inflation. From 1965-1970, inflation rose from 1.6% to 5.9%, and long term Treasuries lost 36% in real terms. The lesson from the 1960s is that inflation can sneak up on you very quickly. Of course there are fundamental structural differences in the economy that make it harder to see inflation creep up the way it did in the 1960s and 1970s, so it is probably unlikely that we will see any sort of 1970s conflagration. First, the US was insulated from globalization in the late 60s and early 70s as postwar Asia and Europe were still rebuilding. Second, union contracts had automatic cost of living increases which caused wage-push inflation. Today, we don't have that. In fact, technology is replacing labor, which is pushing costs down, not up. Capacity Utilization rates were in the high 80s back then versus mid 70s now. Inflation is a case of too much money chasing too few goods. We might have too much money at the moment, but we don't have too few goods. If anything, we have too much money chasing too few assets, which is why we have experienced asset bubbles over the past 30 years, not inflation. 

Speaking of asset price inflation, the best investment in inflationary times can be real estate, especially when you use a 30 year fixed rate mortgage. 

Single women buy houses as twice the rate of single men. Most likely explanation: kids.

Last week, I participated in a webinar for HousingWire where we discussed interest rates, regulation, and MI. The playback is here.

Tuesday, December 27, 2016

Morning Report: Home prices surge in October

Vital Statistics:

Last Change
S&P Futures  2261.2 1.2
Eurostoxx Index 360.5 0.5
Oil (WTI) 52.2 0.1
US dollar index 93.4 0.2
10 Year Govt Bond Yield 2.56%
Current Coupon Fannie Mae TBA 103
Current Coupon Ginnie Mae TBA 104
30 Year Fixed Rate Mortgage 4.29

Stocks are flattish this morning on no real news. Bonds and MBS are up small. 

Expect a dull week with thin volume on the exchanges as many traders take this week off. We will have some minor economic reports this week, but nothing should be market-moving. 

New Home Sales increased to 592k in November. This is an increase of 17% YOY. New home inventory is about 250k, which is a 5.1 month supply at current levels. The median sales price was $305k, while the average sales price was $359k. The Midwest and the West had the biggest increases in sales. 

Home prices rose 5.6% in October, according to the Case-Shiller Home Price Index. Affordability measures have shown 20% - 30% decreases since home prices bottomed in 2012. While affordability is not yet at a point to suggest a reversal in home price appreciation, we are probably approaching the limits of home price appreciation unless wage growth accelerates. 


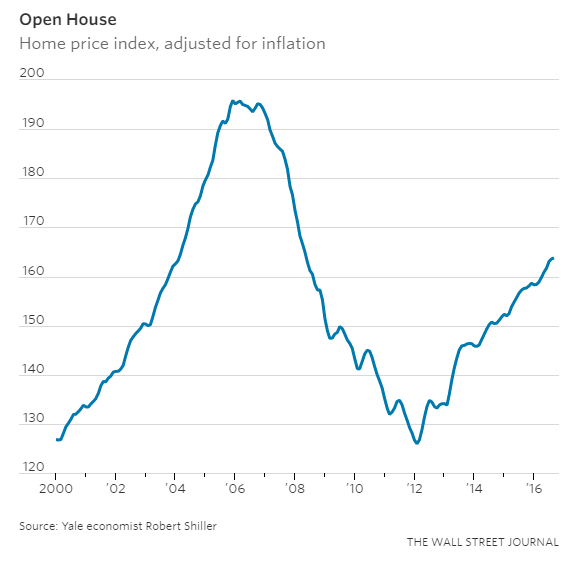
Note that these indices are not inflation-adjusted. While inflation has been pretty tame over the past 10 years, it hasn't been zero. If you adjust the index for inflation, we are still below our 2006 highs.


The national foreclosure inventory fell below 500k for the first time in 10 years, according to Black Knight Financial Services. Delinquencies ticked up on a seasonal basis, but are down almost 10% YOY. Improvements in delinquencies are getting smaller as the market normalizes. 

For bond investors who were taken by surprise by the Fed's forecast of 3 rate hikes this year, it is instructive to look at how many hikes they thought they would be making this year. In fact, no one suggested less than 2. We only had one. This again stresses the data-dependency of what the Fed is thinking. GDP growth came in slower than expected, and then we had Brexit, which caused the Fed to think about being less aggressive. Ultimately, it will depend on inflation and whether it returns. Despite inflation being below the Fed's target rate, they still plan to tighten. 

Consumer confidence jumped in November, driven primarily by the election and improving expectations for future growth. Note that the current conditions part of the index actually fell, so this is largely a jump based on the perception of the future which may not play out as assumed. 

Tuesday, September 27, 2016

Morning Report: Home prices rise 5%

Vital Statistics:

Last Change
S&P Futures  2142.2 2.0
Eurostoxx Index 338.6 -1.0
Oil (WTI) 44.8 0.5
US dollar index 86.4 -0.2
10 Year Govt Bond Yield 1.56%
Current Coupon Fannie Mae TBA 103.3
Current Coupon Ginnie Mae TBA 104.2
30 Year Fixed Rate Mortgage 3.47

Markets are lower this morning on no real news. Bonds and MBS are up small.

Donald Trump and Hillary Clinton had their first debate last night. Early polls are showing Hillary won, however the debates went up against Monday Night Football, so the sample is going to skew female. Major media outlets are declaring the winner based on their ideological leanings: Bloomberg says Hillary won, and the WSJ says that Trump won. Did the debate change anyone's vote? We'll see, but my suspicion is that people's minds are more or less made up at this point. 

Global bonds have been rallying, but the US 10 year hasn't been following suit. The German Bund is now back at -15 basis points. Meanwhile, Blackrock is advising caution in Treasuries as the Fed starts hiking rates. Global central banks are selling Treasuries, which is putting pressure on yields. 

Tim Duy says December is a good bet for another tightening, but next year's voting members will skew more dovish than the current FOMC.

Home prices were flat month-over-month and are up 5% for the year, according to the Case-Shiller home price index. The real estate indices are beginning to show a slowdown in home price appreciation. Until we start seeing wage inflation, real estate prices will be stretched versus incomes. The labor market continues to send mixed signals


Tuesday, July 26, 2016

Morning Report: New Home Sales climb

Vital Statistics:

Last Change
S&P Futures  2163.0 -0.3
Eurostoxx Index 341.8 2.0
Oil (WTI) 42.5 -0.6
US dollar index 88.1 0.2
10 Year Govt Bond Yield 1.56%
Current Coupon Fannie Mae TBA 103.3
Current Coupon Ginnie Mae TBA 104.2
30 Year Fixed Rate Mortgage 3.53

Markets are flattish on no real news. Bonds and MBS are up small.

New Home Sales rose to 592k in June, much higher than the Street expectation. The median new home price rose 6.1% YOY to $306,700. There is about 4.9 month's worth of inventory right now, compared to 5.1 months in May. 

Consumer confidence slipped in June to 97.3 from 97.4.

Home prices continued to appreciate in May, according to the Case-Shiller Home Price Index. “Home prices continue to appreciate across the country,” says David M. Blitzer, Managing Director and Chairman of the Index Committee at S&P Dow Jones Indices. “Overall, housing is doing quite well. In addition to strong prices, sales of existing homes reached the highest monthly level since 2007 as construction of new homes showed continuing gains. The SCE Housing Expectations Survey published by the New York Federal Reserve Bank shows that consumers expect home prices to continue rising, though at a somewhat slower pace.”

The FOMC starts its meeting today, and we will get the decision tomorrow around 2:00 pm. Here is a good take on how to parse the FOMC statement. The key will be the characterization of the economy in the first paragraph. If the Fed notes an improvement in the economy since June, then that could be interpreted as a step towards hiking in September. 

Is wage growth beginning to pick up?  One key will be the employment cost indicator, which will be released on Friday. The ECI was depressed in the second quarter of 2015, so we should get a mid 2% YOY comparison. Is that enough to convince the Fed that inflation is returning to their 2% target? Possibly, but the Fed has said they are going to let the labor market run hot for a while. Don't forget, even if the Fed hikes rates 25 basis points this year, monetary policy is still at emergency-level accommodation. Note that many indicators are showing that the economy is recovering well, and the doves will be on the defensive at some point

Interesting article about how it is so hard to make affordable housing affordable. Trying to build in an urban area and hold rents down to $500 a month is impossible without government subsidies. Regulatory issues like open space set asides also do not help. This is also an issue with starter homes, especially in high cost urban areas on the West Coast. By the time you build and comply with all the regulations, you are looking at a $500k + price tag, which is way out of the range of the typical first time homebuyer. 


Wednesday, June 29, 2016

Morning Report: Brexit panic over?

Vital Statistics:

Last Change Percent
S&P Futures  2042.0 13.6 0.67%
Eurostoxx Index 2816.4 57.7 2.09%
Oil (WTI) 48.26 0.4 0.86%
LIBOR 0.627 0.004 0.56%
US Dollar Index (DXY) 95.89 -0.351 -0.36%
10 Year Govt Bond Yield 1.48% 0.01%
Current Coupon Ginnie Mae TBA 106
Current Coupon Fannie Mae TBA 105.4
BankRate 30 Year Fixed Rate Mortgage 3.6

Stocks are higher this morning as global stocks and commodities rally. Bonds and MBS are flat.

It seems like the big Brexit-related sell-off might be over.  Brexit will have a negligible effect on US corporate earnings, and stocks will benefit from a lower, steadier interest rate environment. I would look for the correlation between US stocks and global stocks to break down gradually. I am not sure we will see the same effect in the Treasury markets as the global bond market is simply much more integrated. Speaking of which, global bond yields are holding steady this morning, with the German Bund at -11 basis points and the the PIIGS slightly lower. 

First quarter GDP was revised to +1.1%. while personal consumption came in at 1.5% and the PCE index (the inflation measure preferred by the Fed came in at 0.4%). Housing as a percentage of GDP increased. I have long said the difference between this sub-par economy and a strong one is housing. Politicians have yet to figure this out.

Home prices rose .5% MOM and 5.4%YOY, according to the Case-Shiller home price index. Home prices in 7 MSAs (Denver, Dallas, Portland OR, San Francisco, Seattle, Charlotte, and Boston) have eclipsed their 2006 peaks. 

Personal Incomes rose 0.2% in May, slightly below forecasts, while personal spending increased 0.4%, right in line with expectations. For the month, the PCE core index rose 1.6% YOY, which is still below the Fed's target of 2%. 

Mortgage Applications fell 2.6% last week as purchases fell 3% and refis fell 2.4%. Pending Home Sales fell 3.7% MOM in May and are up 2.4% YOY. 

The Fed is scheduled to release the results of its stress tests for the largest US banks. The results should come out after the close. Billions of dollars in dividends and buybacks are on the line. Separately, GE's systemic designation has been rescinded by US regulators. GE is the first institution to have the designation removed, which requires stringent capital and leverage requirements. GE has sold much of its GE Financial division, and has returned to its roots as an industrial manufacturer. 

Speaking of banking crises, the European big banks have stabilized in the aftermath of Brexit. The canaries in the coal mine are Deutsche Bank and Unicredito. Even Barclay's and RBS have stabilized. The thing to keep in mind is that the banks now have almost double the capital they had in 2008 and Brexit is nothing like the bursting of the US residential real estate bubble. The Bernank agrees.

Freddie Mac wonders if the homeownership rate can fall below 50%. The current level is at 63.5%, which is the lowest in 22 years, and just off the low of 63%, which goes back to 1965, when Census started tracking the statistic. They look at 3 studies, which all predict lower homeownership going forward. The factors inhibiting an increase in homeownership are lower income growth, high rental prices, tight supply and and high student loan debt / tight credit. It is hard to tell what a "normal" homeownership rate as the 2005 spike was the result of a bubble and a lot of social engineering via the housing market, which really started early in the Clinton Administration.


Tuesday, April 26, 2016

Morning Report: Home prices continue to rise, but are there problems at the high end?

Vital Statistics:

Last Change Percent
S&P Futures  2086.6 3.4 0.16%
Eurostoxx Index 3125.0 7.4 0.24%
Oil (WTI) 43.23 0.6 1.38%
LIBOR 0.636 -0.002 -0.35%
US Dollar Index (DXY) 94.42 -0.423 -0.45%
10 Year Govt Bond Yield 1.92% 0.00%
Current Coupon Ginnie Mae TBA 105.3
Current Coupon Fannie Mae TBA 104.4
BankRate 30 Year Fixed Rate Mortgage 3.68

Talk about it here: http://thenadtearsheet.blogspot.com/

Stocks are up this morning on overseas strength. Bonds and MBS are flat.

The S&P / Case-Shiller index of home prices rose .66% on a MOM basis and is up 5.38% YOY. Their take on the housing market: “Mortgage defaults are an important measure of the health of the housing market. Memories of the financial crisis are dominated by rising defaults as much as by falling home prices (see first chart). Today as well, the mortgage default rate continues to mirror the path of home prices. Currently, the default rate on first mortgages is about three-quarters of one percent, a touch lower than in 2004. Moreover, the figure has drifted down in the last two years. While financing is not an issue for home buyers, rising prices are a concern in many parts of the country. The visible supply of homes on the market is low at 4.8 months in the last report. Homeowners looking to sell their house and trade up to a larger house or a more desirable location are concerned with finding that new house. Additionally, the pace of new single family home construction and sales has not completely recovered from the recession."

In other economic news, durable goods orders rose 0.8% in March, versus Street expectations of an increase of 1.9%. Capital Goods orders (a proxy for business capital investment) was flat. The Markit US Services PMI and the Markit US Composite PMI indices both improved in April. The Richmond Fed Manufacturing index fell, as did consumer confidence. 

The FOMC begins their two day meeting today. Here is Mohammed El-Arian's take on what to look for in the statement. Here is a more in-depth parsing of what the Fed may say and what it means. 

What is going on this weekend aside from the NFL draft? Buffetapalooza or Woodstock for Capitalists. The Berkshire Hathaway shareholder meeting in Omaha, where you can play ukelele with the Fruit of the Loom guys listen to Warren wax poetically about value investing. This year, it will be streamed live. 

We are starting to see weakness in the top end of the hottest real estate markets as supply surges and foreign demand begins to wane. Will it spread?

Did you know Trump and Hillary share the same address?

Tuesday, March 29, 2016

Morning Report: Luxury condo glut in Manhattan?

Vital Statistics:

Last Change Percent
S&P Futures  2023.5 -4.5 -0.22%
Eurostoxx Index 2997.0 10.3 0.34%
Oil (WTI) 38.53 -0.9 -2.18%
LIBOR 0.629 -0.002 -0.24%
US Dollar Index (DXY) 95.91 -0.035 -0.04%
10 Year Govt Bond Yield 1.85% -0.04%
Current Coupon Ginnie Mae TBA 105
Current Coupon Fannie Mae TBA 104.4
BankRate 30 Year Fixed Rate Mortgage 3.71

Markets are lower this morning on weaker commodity prices. Bonds and MBS are up small.

Pending Home Sales increased 3.5% MOM and are up 5.1% YOY. This is the best number in a year, and points to a strong Spring Selling Season. Lack of inventory remains a problem. 

Janet Yellen will be speaking around noon EST today. Don't expect her to break any new ground, but just be aware. 

Inflation remains tough to find, but both BlackRock and PIMCO are calling for investors to add an inflation hedge, either by switching out of Treasuries into TIPS or by buying gold. 

Barclay's is calling the latest rally in commodity prices a dead cat bounce, and is calling for a steep decline as fast money exits en masse. 

Home prices rose .52% month-over-month according to Case-Shiller. Prices are up 5.4% YOY. Portland, Seattle, and San Francisco reported the biggest gains. Again, tight inventory remains an issue, along with tight credit for the first time homebuyer. 

Prices continue to defy gravity in New York City, however the demand for luxury condos is beginning to wane. 423 Park Avenue, now home of the tallest residential building in the Western Hemisphere, has 141 apartments for sale and luxury buyers are beginning to fade as foreign money is hesitant. Yet Manhattan is dotted with cranes, largely building high-end condos. 

Homebuilder Lennar reported better than expected earnings this morning. EPS is the highest third quarter number since 2006. Average selling prices increased 12% to $365,000 while new orders increased 10% in units and 15% in dollar volume.