| Last | Change | |
| S&P Futures | 2433.0 | 1.3 |
| Eurostoxx Index | 387.2 | -1.3 |
| Oil (WTI) | 42.9 | 0.1 |
| US dollar index | 88.7 | -0.1 |
| 10 Year Govt Bond Yield | 2.15% | |
| Current Coupon Fannie Mae TBA | 103.31 | |
| Current Coupon Ginnie Mae TBA | 104.375 | |
| 30 Year Fixed Rate Mortgage | 3.92 |
Stocks are flattish after the Fed gave a clean bill of health to the banks it stress-tested. Bonds and MBS are up small.
One year ago today, the UK voted to leave the EU, which ignited a big rally in the bond market and pushed the 10 year down to a 1.37% yield.
New Home Sales ticked up in May to a seasonally adjusted pace of 610k. This was up 2.9% MOM and 8.9% YOY. The median new home sales price was $345,800 and the average price was $406,400. There are 268,000 new homes for sale at the moment. The 610k print was pretty much the average for the US from 1965-1995. New home sales peaked at over 1.3 million during the bubble years, but we are still a long way from normalcy, given population growth and obsolescence.

34 systemically important banks passed their stress tests yesterday. The banks are getting better at passing these exams, and the sense is that the Trump Administration will nominate someone to the Fed who will dial back these exams a bit. Next week, the Fed will release its comprehensive capital review, which will determine whether the big banks can increase their dividends or buy back stock.
Here is a good way to determine how tight a local housing market is: compare the ratio of new jobs to new building permits. In the Bay Area, that ratio is 6.4x: over the past 5 years, that MSA has added 373,000 new jobs, but has issued permits for only 58,000 new units. Lack of land, along with regulatory issues are holding back building there. In less constrained MSAs (both land and regulation) like Houston, the ratio is 1.3x. For the whole US, the country added just about 2.2 million jobs in 2016 and building permits totaled about 1.2 million, or a ratio of 1.8x.
The Canadian housing bubble continues to defy gravity, but the signs are there that its days are probably numbered. Warren Buffet took a 38% stake in troubled Canadian lender Home Capital and agreed to provide a $2 billion line. You can see from the chart below how far the Canadian bubble has exceeded the US one: Note that these are inflation-adjusted indices which is why US prices appear to have not recouped the losses from the bubble years. They have on a nominal basis, but not an inflation-adjusted basis.
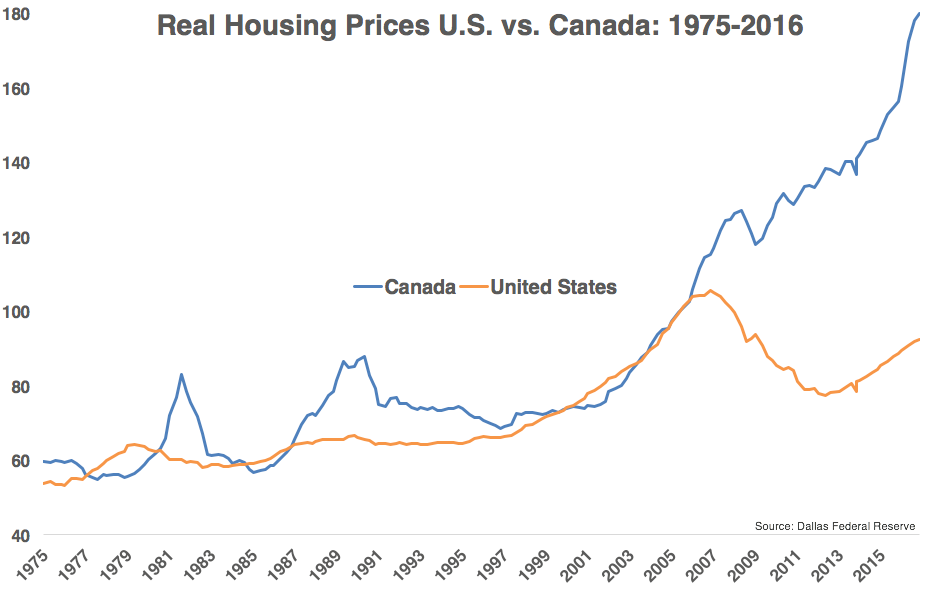
The current median house price in Canada is about 520k and the median income is about 76k, putting the median house price to median income ratio at 6.8x. The US ratio peaked at 4.8x, which gives you some idea of how far prices have gone up North. Once the bubble bursts, it is bound to have some knock-on effects in the US, especially at the high end of the market which is probably more linked to China's bubble than people care to admit.
The US Government has recommended that the new benchmark short term rate become the Treasury repo rate instead of LIBOR, which is subject to manipulation (as we saw in the UK). Not sure how this will affect current adjustable rate mortgages, but new ones will probably lose LIBOR and will use constant maturity treasuries or some alternative index.
No comments:
Post a Comment