| Last | Change | |
| S&P Futures | 2382.3 | -3.5 |
| Eurostoxx Index | 389.0 | -0.4 |
| Oil (WTI) | 47.8 | 0.2 |
| US dollar index | 89.8 | |
| 10 Year Govt Bond Yield | 2.29% | |
| Current Coupon Fannie Mae TBA | 102.84 | |
| Current Coupon Ginnie Mae TBA | 103.92 | |
| 30 Year Fixed Rate Mortgage | 4.04 |
Markets are quiet ahead of the Fed decision this afternoon. Bonds and MBS are flat.
Back from the MBA Secondary Conference. Q1 was dismal for pretty much everyone, but people are thinking interest rates are heading lower not higher.
The FOMC decision will be out at 2:00 pm EST. Nobody expects the Fed to make any policy changes, but the wording in the statement could move markets. Just be prepared for some volatility around that time and be careful with locks.
The ADP jobs report came in at 177k, a little bit better than the 170k forecast. The Street is looking for 185k jobs in this Friday's employment situation report.
Mortgage Applications fell 0.1% last week as purchases rose 4% and refis fell 5%.
Personal incomes rose 0.2% last month and consumer spending was flat. The core PCE index (the inflation measure preferred by the Fed) came in at 1.8%, below the Fed's 2% target rate.
The ISM manufacturing Index slipped to 54.8 from 56, while the ISM non-manufacturing index improved to 57.5 from 55.8.
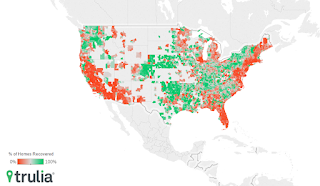
Home prices rose 1.6% MOM and are up 7.1% YOY according to the CoreLogic Home Price Index. The index is within 2.8% of its April 2006 peak. The FHFA House Price Index has already recouped its losses from the bubble years. They forecast a 5% increase this year and see the index recouping the bubble losses in late summer. Here is a map of the overvalued (red) and the undervalued (green) MSAs.
Given that the house price indices are approaching or have already surpassed their past peaks, you would figure that most houses in the US would be at those levels as well. Unfortunately, they are not. In fact, Trulia estimates that only 1/3 of houses have recouped the losses from the bubble. There is a huge dispersion as well - only 3% of homes in Fresno or Las Vegas or the NYC suburbs have surpassed their prior peak levels, while 94% of homes in Denver or San Francisco have. The problem with these home price indices is that they use a repeat sales methodology, which tends to over-emphasize hot markets. Real estate prices in states exposed to the tech sector and the energy sector are performing the best. Surprisingly, flyover America is doing better than Coastal America. On the link, you can do a county-by-county analysis to see where you stack up.
Housing continues to punch below its weight in terms of contribution to GDP. Residential construction has historically been around 2% of GDP, and based on the first quarter estimate it was closer to 1.3%. We have incredibly tight demand for homes, so why aren't we seeing building? It depends on who you ask. If you ask a builder in a hot market, the problem is lack of skilled labor. In other areas, regulation and credit are the culprits. The housing market continues to be a conundrum for policy makers and analysts.


No comments:
Post a Comment