A place where economics, financial markets, and real estate intersect.

Monday, June 25, 2012

Morning Report

Vital Statistics:


Last Change Percent
S&P Futures  1310.5 -16.3 -1.23%
Eurostoxx Index 2135.2 -51.6 -2.36%
Oil (WTI) 78.44 -1.3 -1.65%
LIBOR 0.461 -0.001 -0.22%
US Dollar Index (DXY) 82.51 0.250 0.30%
10 Year Govt Bond Yield 1.62% -0.06%  
RPX Composite Real Estate Index 181.4 0.2  


A soggy tape to match a soggy morning here on Wall Street. There is no real news driving futures down, just a sense of malaise coming out of watching the European slow-motion train wreck. Euro sovereigns are slightly wider, while the US 10-year is up about a point.  MBS are higher as well.

New Home Sales came in at 369k, well ahead of expectations of 347k. That said, we are still running at levels below the bottoms of recessions going back to the 1960s and well below the average 700k pace from 1963 to the bubble burst.


We have a lot of economic data this week, with April Case-Schiller and Consumer Confidence coming out tomorrow, Durable Goods and pending home sales Wed, Initial jobless claims and final Q1 GDP numbers on Thurs, and Personal Income / Spending numbers on Fri.  We also have a European summit (something like #18) and will potentially hear the fate of Obamacare as well.

We are in earnings pre-announcement season, where companies who are going to miss their quarters disclose it to the market. Earnings season will officially begin in two weeks with Alcoa's numbers.

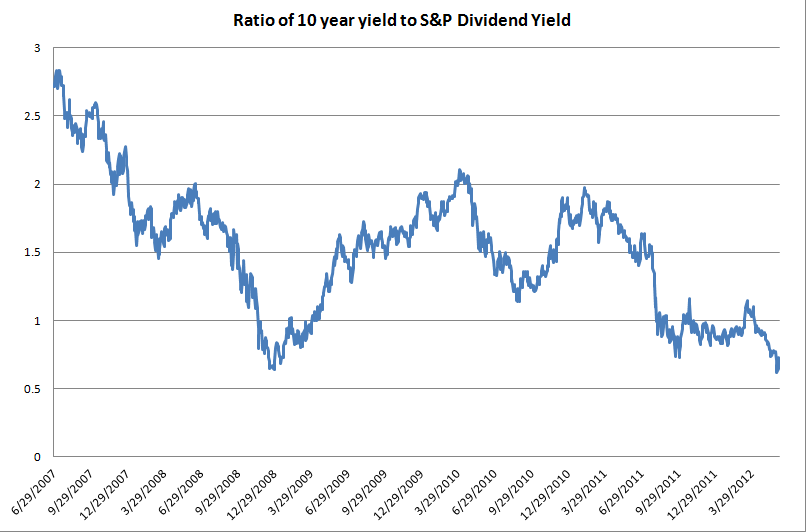
Treasury yields will hit 1% by  year end, says CNBC.  Certainly that is a possibility if nothing is done about Taxmageddon or if Europe implodes.  Simon Johnson is worried about how US banks will handle a European implosion, and even introduces a new risk we can wring our hands over:  Dissolution Risk.

The Chicago Fed National Activity Index declined to -.45 in May from +.08 in April, which indicates slowing economic growth. Positive numbers indicate the economy is growing above trend, while negative numbers indicate the economy is growing below trend. The 3 month moving average, decreased to -.34 from -.13 in May.  If the 3 month moving average falls below -.7, it typically means a recession has already begun.


$9.3 billion.  That is the amount of money people lose per year responding to those ubiquitous Nigerian email scams.  To put that number in perspective, that is roughly what GM made last year and accounts for 11% of Nigeria's GDP.

Thursday, June 21, 2012

Morning Report

Vital Statistics:

Last Change Percent
S&P Futures  1351.2 0.5 0.04%
Eurostoxx Index 2220.9 13.5 0.61%
Oil (WTI) 80.75 -0.7 -0.86%
LIBOR 0.468 0.000 0.00%
US Dollar Index (DXY) 81.6 0.012 0.01%
10 Year Govt Bond Yield 1.65% -0.01%  
RPX Composite Real Estate Index 180.7 0.2  


Markets are flattish after a mixed Spanish bond auction and disappointing jobless claims numbers. Spain auctioned off 2.2 billion euros of 5 year debt, with a bid / cover ratio of 3:1, however it paid 6.07%.  Sovereign yields across Europe are lower, as are Treasuries with the 10 year down a basis point. MBS are up slightly.

Yesterday, the Fed maintained low interest rates and committed to extend Operation Twist through the end of the year. Notably, the Fed took down its projections for GDP growth and bumped up its estimates for unemployment. Here is a "marked up" version of the statement, showing the changes from the April release. Note that the Fed took down its numbers in spite of a massive rally in the 10-year and mortgages courtesy of Europe.

Initial Jobless Claims came int at 387k, down from a revised 389k the prior week and more or less in line with expectations. Philly Fed was a disappointment as the Business Outlook Survey indicated weaker business conditions in its area.  Rounding out the day's economic data, May existing home sales came in at a 4.55 million annual rate, a drop of 1.5% MOM.

The FHFA House Price index was up .8% in April, while March was revised downward from + 1.8% to +1.6%. The FHFA House Price Index only considers Fannie and Freddie loans, so it acts as somewhat of a "center tendency" of the market, ignoring the high price and low price extremes. It certainly appears like the trend has shifted.  See chart below:


Software Provider Ellie Mae released its May Origination Insight Report which provides data on mortgages originated though its Encompass system. The typical closed loan had a FICO of 744, a LTV of 81, and a DTI score of 24/35.  A typical denied application had a FICO of 702, a LTV of 88, and a DTI of 28/43. The mix of refis vs purchase dropped to 54/46 from 56/44 in April and 61/39 in March, which is surprising given the drop in mortgage rates over the past 3 months. Closing times continue to increase, with the time to close up to 46 days from 42 in March. Overall, it shows a tight mortgage market with great rates for those who qualify.

On opposite ends of the economic spectrum, Octomom is getting foreclosed upon, while Larry Ellison is buying a Hawaiian Island.

Wednesday, June 20, 2012

Morning Report

Vital Statistics:

Last Change Percent
S&P Futures  1352.0 1.4 0.10%
Eurostoxx Index 2198.5 0.5 0.02%
Oil (WTI) 84.09 0.1 0.07%
LIBOR 0.468 0.000 -0.05%
US Dollar Index (DXY) 81.24 -0.142 -0.17%
10 Year Govt Bond Yield 1.64% 0.02%  
RPX Composite Real Estate Index 180.5 0.2  


Markets are slightly firmer as Antonis Samaras looks to be sworn in as premier of the new coalition government in Greece. This is taking pressure off of Italian and Spanish borrowing rates as well. As we approach the end of the quarter, we begin preannouncement season, where companies that are going to miss their quarterly estimates fess up. Today's victim:  Proctor and Gamble which is lowering its revenue and profit outlook on European weakness.  The earnings season officially kicks off in a couple of weeks with Alcoa announcing on July 9.

Other than Greece, markets will focus on the FOMC announcement later today, particularly with respect to Operation Twist, which is scheduled to end soon. There has been speculation that the Fed would continue Operation Twist, perhaps by buying mortgage backed securities directly instead of the 10-year. Don't forget we have gotten 73 basis points worth of stimulation in the last 3 months courtesy of Europe, while mortgage rates have not participated fully.  That said, since the 10-year bottomed at 1.45% in early June, the underperformance has been correcting. See chart below:


The Fed is conducting Operation Twist because it wants mortgage rates down, not because it thinks the 10-year bond is too expensive. So the Fed will undoubtedly be focusing on the spread between mortgage rates and Treasuries as well as the overall level of interest rates. 

In its June Economic Outlook, Freddie Mac notes the strength in the rental market as vacancy rates fall. This is driving construction activity and Freddie estimates that multi-fam construction will add 200,000 units this year, the most since 2008. A drop in the homeownership rate is driving this demand as well as the high downpayments required for new homebuyers. Between the historically low housing starts of the last ten years (never mind population growth), the low household formation (as new grads move back in with Mom and Dad), and historic affordability we are creating pent up demand for housing that will be released into the market once the economy picks up some steam. 


Tuesday, June 19, 2012

Morning Report

Vital Statistics:

Last Change Percent
S&P Futures  1332.5 -5.0 -0.37%
Eurostoxx Index 2166.7 -14.5 -0.66%
Oil (WTI) 82.89 -1.1 -1.36%
LIBOR 0.468 0.000 0.00%
US Dollar Index (DXY) 81.79 0.164 0.20%
10 Year Govt Bond Yield 1.57% -0.01%  
RPX Composite Real Estate Index 180 0.3  


Markets are slightly higher as we await the FOMC meeting on Wed. Overseas, Spain sold 3.04 billion euros worth of bills, higher than its 3 billion target. Euro sovereign yields are lower across the board, while US Treasury yields are flattish. MBS are flat. As we head into the end of the quarter, we will start to hear from companies who are going to miss earnings estimates.

Housing starts came in at a seasonally adjusted annual rate of 708k. This was below April, but was 29% over May 2011's rate. Building Permits, which is a leading indicator for starts came in at 780k. Overall, it shows the housing market is on the mend, although new construction activity is focusing more on multi-family as opposed to single units. Housing's contribution to GDP growth is back to slightly positive, and it is still well, well below historical averages.

Interestingly, the average housing start number for the past 10 years has been a 1.3 million annual rate.  The average annual rate from 1959 - mid 2002 was around 1.5 million / year. Pre-crisis, housing formation numbers had been running at around 1.2 million / year. This certainly helps explain the nascent demand in multi-fam construction as those people have to live somewhere, but it also suggests that a lot of the overbuilding from the bubble has been worked off.

Chart:  Housing starts 1959-Present


Monday, June 18, 2012

Morning Report

Vital Statistics:

Last Change Percent
S&P Futures  1332.5 -5.0 -0.37%
Eurostoxx Index 2166.7 -14.5 -0.66%
Oil (WTI) 82.89 -1.1 -1.36%
LIBOR 0.468 0.000 0.00%
US Dollar Index (DXY) 81.79 0.164 0.20%
10 Year Govt Bond Yield 1.57% -0.01%  
RPX Composite Real Estate Index 180 0.3  


Markets are weaker this morning on a rise in Spanish bond yields, which are 34 basis points higher to 7.22%.  Over the weekend, the pro-bailout parties won in Greece, and their bond yields are a percentage point lower. US bonds are up half a point, and MBS are up slightly as well.

Lots of economic data this week regarding housing, with NAHB today, Housing Starts tomorrow, the FOMC on Wed, and existing home sales on Friday. The NAHB index came in at 29, the highest level since May of 2007, as low rates and low prices are creating demand for home builders.  Regionally, the West and the Midwest gained, while the Northeast and the South declined.

Home equity in Q1 rose to $6.7 trillion, the highest level since 2008 as borrowers refi their mortgages and often bring cash to the table to pay down principal. In addition, many borrowers are shortening the terms of their loans. This shows part of the problem with the economy right now, as consumers save (by paying down debt). This will be good for the economy long-term, although it is a headwind now.

In another positive data point for the housing market, we have a bidding war for Rescap, GMAC's bankrupt housing unit between Fortress and Warren Buffet. For Buffet, there a synergies between Berkadia's servicing operations, and its Clayton manufactured housing unit.


Friday, June 15, 2012

Morning Report

Vital Statistics:

Last Change Percent
S&P Futures  1327.5 1.3 0.10%
Eurostoxx Index 2179.6 31.4 1.46%
Oil (WTI) 84.02 0.1 0.13%
LIBOR 0.468 0.000 0.00%
US Dollar Index (DXY) 81.91 -0.078 -0.10%
10 Year Govt Bond Yield 1.59% -0.05%  
RPX Composite Real Estate Index 179.8 0.3  

Markets are slightly better on speculation of further stimulus measures out of the world's central banks. We are seeing a tightening across the board with Euro sovereigns, particularly Greece. The US 10-year is yield is lower as well, with MBS up a few ticks. Today is Triple Witching, with the expiration of options and futures.

The Empire State Manufacturing Survey came in well below expectations, and dropped precipitously from May's number based on a steep drop in shipments. Overall, the report suggests that business activity is still expanding (slightly) but optimism is waning. Separately, capacity utilization fell from 79.2% to 79% and industrial production fell .1%.

Harvard's Joint Center for Housing Studies released their State of the Nation's Housing Market Survey yesterday. Punch line: The housing market appears to have turned the corner, however further economic weakness could stall it again. They note that housing construction is finally a positive contributor to GDP.  They also include a chart showing that the relative attractiveness of owning vs renting is as high as it has been since the early 70's:

As if we didn't have enough to worry about on the horizon, an ex-Soros advisor warns us about Japan, where he envisions a Japanese government bond default by 2017. The IMF is forecasting the Japanese debt to GDP ratio will increase to 245% by 2014. “The yen and the JGB market are in a bubble,” Fujimaki said. “With the gigantic debt Japan has accumulated, a thin needle, or even a gentle breeze may pop this. Events in Europe can possibly trigger this to blow up.”  While some people bemoan that we are potentially following the European track, Japan is the final stop on the track they propose.


Thursday, June 14, 2012

Morning Report

Vital Statistics:

Last Change Percent
S&P Futures  1306.1 -2.7 -0.21%
Eurostoxx Index 2134.4 -9.1 -0.42%
Oil (WTI) 82.42 -0.2 -0.24%
LIBOR 0.468 0.000 0.00%
US Dollar Index (DXY) 82.17 0.107 0.13%
10 Year Govt Bond Yield 1.59% 0.00%  
RPX Composite Real Estate Index 179.5 0.4  


Markets are weaker after Moody's downgraded Spain to one notch over junk and initial jobless claims came in higher than expected. The chart suggests that the trend in initial jobless claims may be changing. The CPI remained muted. Bonds and MBS are slightly lower.

FHFA released its annual report to Congress on the state of the GSEs. The average 2011 mortgage in their portfolio is very high quality - Average LTV < 70%, Average FICO in the mid 70s. The worst stuff (the no-doc and IO loans are finally gone).  FHFA characterizes the GSEs as "stabilized" but not "sound."  Fannie and Fred guarantee roughly $100 billion per month and account for 75% of every mortgage originated in 2011. They owe Treasury $187.5 billion.

The NAHB has listed 80 metro areas in their Improving Market Index for June. To be included in the index, the are must have shown improvements in housing permits, employment, and house prices for at least six consecutive months. This is a drop from May where 100 areas were in the index. Map.

The consensus seems to be that Jamie Dimon did well yesterday, by showing contrition where necessary, yet pushing back when he had to as well. The business press seems to believe the Senators went too easy on Dimon.

In keeping with the "where is the inventory" thread I have been discussing the past few days, here is another: Private Equity has raised more than $6 billion to buy and rent foreclosed homes, yet have only deployed about $2 billion of it. Analysts are concerned that political pressure out of Washington is delaying the bulk sales. Maybe someone in Washington wants to goose the housing indices a little bit. He may end up being too clever by half - when the ducks are quacking, you gotta feed them or they go away...

Chart:  Initial Jobless Claims:


Wednesday, June 13, 2012

Morning Report

Vital Statistics:

Last Change Percent
S&P Futures  1314.8 -5.3 -0.40%
Eurostoxx Index 2142.0 -1.4 -0.07%
Oil (WTI) 82.79 -0.5 -0.64%
LIBOR 0.468 0.000 0.00%
US Dollar Index (DXY) 82.31 -0.115 -0.14%
10 Year Govt Bond Yield 1.68% 0.01%  
RPX Composite Real Estate Index 179.1 0.2  


Markets are lower this morning on disappointing retail sales data. April numbers were also revised downward. The Producer Price Index showed inflation at the wholesale level remains under control. Bonds and MBS are lower in spite of the soggy tape. Jamie Dimon gets his close-up today in front of the Senate Banking Committee.

The Lender Processing Services Home Price Index rose .9% in March.  This was the second consecutive monthly increase in the seasonally-adjusted index since 2006. The increase was broad-based geographically, with increases in almost every MSA. That said, March sales volume was extremely low - like mid-90s low - as inventory dried up.  I mentioned a WSJ article yesterday that attempted to address the question why volumes are so low if shadow inventory is so high. Negative Equity is largely the culprit. Also in the report, distressed sales (short sales / foreclosures) made up 40% of the transactions. CNBC notes that new laws like Nevada's foreclosure-reform law are having the unintended (maybe not) consequence of delaying foreclosures and delaying the market-clearing process. California is debating a "Homeowner Bill of Rights" as well. The net result is that the supply of foreclosed properties will continue to be artificially held back and helps explain the low volume of transactions.

In a story that is guaranteed to hit a lot of ideological nerves, the Washington Post profiles a loan officer who claims Wells Fargo steered minority borrowers into no-doc subprime loans. Needless to say, Wells disagrees claiming they never did no-docs in the first place and that the borrowers wouldn't have qualified for prime loans anyway. Ironically, she is now in the mortgage-relief business, which has come under scrutiny by the FTC for charging up-front fees and not delivering anything. Needless to say, this article will produce a lot of heated CRA vs bankster debate.


Tuesday, June 12, 2012

Morning Report

Vital Statistics:

Last Change Percent
S&P Futures  1303.7 3.4 0.26%
Eurostoxx Index 2145.2 7.5 0.35%
Oil (WTI) 82.29 -0.4 -0.50%
LIBOR 0.468 0.000 0.00%
US Dollar Index (DXY) 82.53 0.013 0.02%
10 Year Govt Bond Yield 1.61% 0.02%
RPX Composite Real Estate Index 178.9 0.2

Markets are a touch higher this morning after yesterday's sell-off. Federal Reserve Bank of Chicago President Charles Evans (who Jim Bianco called an uber-dove) said he supports more stimulus. The 10-year yield is back up to 1.61% and MBS are down about 1/4 of a point.

The National Federation of Independent Business Optimism Index ticked down in May. It came in at 94.4, vs 94.5 in the previous month, which is a historically low level. 51% of owners hired or tried to hire in the last three months and nearly 3/4 of those reported few or no qualified applicants for positions. The report has a pretty scathing indictment of Washington, with 22% of the respondents indicating taxes as the single most important problem. 20% reported poor sales, and 19% reported government red tape.

Excerpt from the report: "The Index did not go down by much, that’s the good news. The May reading is still at recession levels from an historical perspective, consistent with very anemic Gross Domestic Product (GDP) and employment growth. The calculus of spending decisions requires an estimate of future sales, tax rates, interest rates and credit availability, labor costs, health care costs, regulatory compliance costs, all of which are very uncertain, meaning that owners cannot make reliable estimates of what will happen to these
factors. Most of this uncertainty is coming out of Washington, D.C. Owners can’t attach probabilities to outcomes or even decide which outcomes to consider.

The amount of political manipulation and evasion to guide the spending of billions of taxpayer dollars is disturbing to owners. Sixty (60) percent of those surveyed said now is a bad time to expand their businesses; one-in four of those owners cited political uncertainty as the main reason, second only to concerns about a weak economy. Investing in jobs or plant and equipment will remain at “maintenance” level until this is resolved."

I would be surprised if this doesn't become campaign fodder.

A study from the Federal Reserve regarding changes in US family finances has been getting a lot of discussion - the median net worth of families has dropped nearly 40% from 2007 to 2010, putting them back where they were in 1992. Most of this is housing-driven, though stocks, student loans, and a drop in incomes are playing a part too.  A generation's worth of wealth creation has been destroyed in 3 years. Of course much of that wealth was illusory, but it does speak to why confidence has been so lousy - the reverse wealth effect. Hopefully housing is in fact bottoming, which will reverse this effect.

The WSJ addresses in interesting question:  if the shadow inventory is so high, why is the inventory of homes actually for sale at normal levels?  It turns out (unsurprisingly) that negative equity is the reason, but also the influx of professional investors scooping up inventory in the hardest-hit areas.  It also explains why prices are rising the most at the bottom end of the market - they have the most negative equity, so supply is the most constrained.

Chart:  NFIB Small Business Optimism Index:


Monday, June 11, 2012

Morning Report

Vital Statistics:

Last Change Percent
S&P Futures  1328.3 6.3 0.48%
Eurostoxx Index 2169.7 25.8 1.20%
Oil (WTI) 85.09 1.0 1.18%
LIBOR 0.468 0.000 0.00%
US Dollar Index (DXY) 82.28 -0.229 -0.28%
10 Year Govt Bond Yield 1.63% 0.00%  
RPX Composite Real Estate Index 178.7 0.0  


Markets are up this morning on a potential bail out for the Spanish banks, although the initial euphoria is wearing off. When I checked in last night, the S&P futures were up 16 points.  Now they are up 6. During the US financial crisis, the one sure-fire trade was to fade any rally brought on by some sort of government rescue. The S&P futures would spike up on news that the government was intervening somewhere, and then would sell off as people realize the intervention is no panacea. US bonds clearly aren't buying it, with the 10 year unch'd. MBS are flat as well.

While equity markets have rallied on the Spanish bailout, Spanish bond yields have not. After trading up to 6%, Spanish government yields are now over 6.4%. As Bill Gross has noted, the Spanish bond market is rigged, as the Spanish banks are encouraged to buy up debt auctions to make the demand for Spanish debt look better than it really is.

Are we there yet? That is the title of CoreLogic's June MarketPulse report on housing. While noting that previous seasonal strength in 2010 and 2011 ended up fading into year-end, CoreLogic postulates that the green shoots we are seeing indicate the market has turned for good. The caveat:  housing won't really turn until the job market is fixed.

Friday, June 8, 2012

Morning Report

Vital Statistics:

Last Change Percent
S&P Futures  1302.7 -7.3 -0.56%
Eurostoxx Index 2143.7 0.6 0.03%
Oil (WTI) 82.22 -2.6 -3.07%
LIBOR 0.468 0.000 0.00%
US Dollar Index (DXY) 82.72 0.666 0.81%
10 Year Govt Bond Yield 1.56% -0.08%  
RPX Composite Real Estate Index 178.7 0.4  


Markets are weaker this morning after some disappointing economic data out of Europe. I guess people were hoping for a little bit more out of the Bernank regarding further stimulus when he testified in front of Congress yesterday. The trade deficit narrowed as imports and exports fell by 1.7% and .8% respectively. Bonds and MBS are both up a little. Overall, it feels like a typical Summer Friday and I would expect most of the Street to be on the L.I.E. by noon.

The Fed voted yesterday to accept the Basel III framework. Rob Chrisman has a good piece on how Basel III will impact mortgage pricing. Essentially the new treatment of mortgage servicing rights will force big lenders like Wells to lower the price they are willing to pay for servicing released premiums. In plain English, this means that Basel III has imposed a higher cost on the banks that will be passed on to borrowers. The Fed estimates that the 19 largest US banks are about $50 billion short of meeting new capital requirements, but they also note that these rules will become fully implemented by 2019 and that most banks should be able to meet the new capital requirements through retained earnings and won't need to raise more capital.

Fannie Mae notes in its National Housing Survey that consumer sentiment seems to be plateauing as we head into the summer selling season. Roughly 1/3 of the respondents expect home prices to rise in the next 12 months and 72% believe now is a good time to buy.

The FHA is planning to announce a bulk sale program today. However, they want to deter "vulture investors" by requiring that the loan buyer to wait 6 months to foreclose and to agree to keep at least half the REO for 3 years.


Thursday, June 7, 2012

Morning Report

Vital Statistics:

Last Change Percent
S&P Futures  1325.5 10.0 0.76%
Eurostoxx Index 2161.6 23.9 1.12%
Oil (WTI) 86.19 1.2 1.38%
LIBOR 0.468 0.000 0.00%
US Dollar Index (DXY) 82.02 -0.306 -0.37%
10 Year Govt Bond Yield 1.66% 0.00%  
RPX Composite Real Estate Index 178.3 0.2  


Markets are higher this morning after China cut interest rates to boost their economy. The benchmark lending rate will drop from 6.56% to 6.31%, effective tomorrow (such precision!). The allowed discount from the benchmark was widened from 10% to 20%.  Initial Jobless Claims in the US came in at 377k, more or less in line with expectations. Bonds and MBS are flat.

Given last Friday's dismal jobs report, the market was definitely concerned about the Fed's Beige Book survey which was released yesterday afternoon. Overall, the tone of the report did not confirm fears of an imminent slowdown. The Fed reported that "overall economic activity expanded at a moderate pace" and that "Economic outlooks remain positive, but contacts were slightly more guarded in their optimism."

In another positive datapoint for the real estate industry, homebuilder Hovnanian reported better than expected earnings yesterday, with a 50% increase in backlog and a 52% increase in contracts. Perhaps this portends the rise in housing starts and construction we have been waiting for since 2008.

To get an idea how cheap stocks are compared to bonds right now, consider the fact that the 10 year yields about 1.65%, while the dividend yield on the S&P 500 is 2.2%. A dividend yield (let alone earnings yield) higher than the 10-year is a rare event. If you look at the ratio of the 10 year to the dividend yield, it reached  just over 60% last week, and the last couple times it reached that level (2008 and fall of 2011), it portended a huge stock market rally. At any rate, it seems to trigger asset allocation decisions and may account for some of the velocity of the moves in the S&P futures and the bond futures. It also means buy stocks and sell bonds.  Or borrow money long term.

Chart:  Ratio of the 10-year bond yield to the S&P 500 dividend yield:


Wednesday, June 6, 2012

Morning Report

Vital Statistics:

Last Change Percent
S&P Futures  1295.7 10.6 0.82%
Eurostoxx Index 2128.5 41.2 1.97%
Oil (WTI) 85.15 0.9 1.02%
LIBOR 0.468 0.000 0.00%
US Dollar Index (DXY) 82.56 -0.265 -0.32%
10 Year Govt Bond Yield 1.59% 0.01%  
RPX Composite Real Estate Index 178.1 0.6  


S&P futures are higher this morning on hopes of further stimulus in Europe.  The ECB left interest rates unchanged. The world seems to be backing away from the ledge a little, selling government bonds and taking more risk. Mortgage rates moved lower only grudgingly last week, so we should expect them to stay more or less stable as the 10-year yield backs up. Nonfarm productivity came in lower than expected, as did unit labor costs. The Fed's Beige Book will be released mid-afternoon.

CoreLogic's April Home Price Index showed a year-over-year gain of about 1%.  Excluding distressed sales, they rose almost 2%. They also introduced a new metric - the Pending Home Price Index - which indicates the trend in prices. This month, the Pending HPI predicts another 2% from April to May. Month-on-month increases are normal seasonal behavior, but year on year increases are more a sign that prices are bottoming.

Clear Capital is reporting more or less the same thing in its June Home Data Index Market Report. It notes that national home prices grew on both a quarterly and yearly basis for the first time since August 2010. Dr Alex Villacorta, Director of Research said:  "While gains in national home prices over the quarter and year were minimal in May, there are encouraging trends continuing to play out and gaining momentum beneath the surface.  Strength in REO-only price trends as well as some early indications of price gains spreading from low tier sections to the mid, and higher priced homes is helping confirm that the country continues to make progress on its recovery, and we are expecting to see improvements extend of the next several months." RTWT.

Given that the mortgage market more or less IS Fannie, Fred, and Ginnie the question now is what to do with them. The Community Mortgage Lenders Association has sent a white paper to the government recommending that we reduce the GSE's involvement in the secondary market to around 33% and that there be an explicit backstop fee paid to the government.


Tuesday, June 5, 2012

Morning Report

Vital Statistics:

Last Change Percent
S&P Futures  1271.0 -2.0 -0.16%
Eurostoxx Index 2076.6 -2.4 -0.11%
Oil (WTI) 83.63 -0.4 -0.42%
LIBOR 0.468 0.001 0.21%
US Dollar Index (DXY) 82.89 0.328 0.40%
10 Year Govt Bond Yield 1.54% 0.02%  
RPX Composite Real Estate Index 177.6 -0.1  


Markets are flat after some disappointing economic data out of Europe. The Eurozone ISM survey came in at 46 and has been below 50 for the past 4 months, indicating a contraction in the manufacturing sector. The  US Non-Manufacturing ISM will be released at 10:00 am, with economists predicting a reading of 53.5. Equity markets seem to be stabilizing, so we are seeing Treasury investors back away from the ledge. MBS are lower as well.

Germany is becoming more amenable to some sort of pan-European banking coordination. Angela Merkel said: "So we will also talk about to what degree one has to bring the systemic banks under specific European supervision to keep national interests from playing too large a role." This will be easier said than done, as countries tend to get very nationalistic when talking about banks. Good luck getting the French on board.

CSFB is predicting the Fed will continue monetary stimulus, with a continuation of Operation Twist and buying mortgages. I am not sure why Operation Twist needs to be continued - Europe has done more to lower long-term interest rates than the Fed could engineer. There has been speculation that the Fed could do a hybrid of sorts, where it sells short term paper and buys mortgage backed securities directly.

NPR has an article on the future of the American Dream - homeownership. While most of the article discusses the psychological differences between homebuyers during the bubble and homebuyers before the bubble, they have an interesting chart from showing how much cheaper it is to buy than rent. The chart shows ratio of the cost of homeownership vs the cost of renting since 1986.  The costs are now equal, even if you ignore the interest deduction.

Chart:  Rent vs Buy


Monday, June 4, 2012

Morning Report

Vital Statistics:

Last Change Percent
S&P Futures  1277.0 3.1 0.24%
Eurostoxx Index 2088.7 20.0 0.97%
Oil (WTI) 82.46 -0.8 -0.93%
LIBOR 0.468 0.001 0.21%
US Dollar Index (DXY) 82.74 -0.152 -0.18%
10 Year Govt Bond Yield 1.50% 0.05%  
RPX Composite Real Estate Index 177.6 0.3  


S&P futures are up 3 points after having been down 12 points in the overnight session. A drop in Euro sovereign yields seems to account for the better tone. China's non-manufacturing PMI dropped to 55.2 in May from 56.1 in April, indicating that their economy is decelerating. The 10-year yield has increased to 1.5% and mortgage backed securities are down a tick.

This week will be a relatively data-light week, in contrast to last week (especially Friday). However, there will be lots of Fed-speak all week and investors will be parsing each statement for further clues regarding QE.  It may turn out that the Fed conducts Operation Twist by purchasing MBS instead of Treasuries.

One of the reasons why this recovery has proven to be so unsatisfying has been the lack of construction activity, which usually leads the economy out of a recession. The Atlantic has a chart that shows construction jobs as a percent of total jobs is at levels not seen since 1946.

Laurie Goodman of Amherst Securities weighs in on how regulators are creating a credit crunch.

Chart:  Construction jobs as a percent of total jobs:


Friday, June 1, 2012

Morning Report

Vital Statistics:


Last Change Percent
S&P Futures  1282.1 -27.1 -2.07%
Eurostoxx Index 2076.9 -42.0 -1.98%
Oil (WTI) 83 -3.5 -4.08%
LIBOR 0.468 0.001 0.21%
US Dollar Index (DXY) 83.31 0.266 0.32%
10 Year Govt Bond Yield 1.46% -0.10%  
RPX Composite Real Estate Index 177.4 -0.1  


Ugly.  That is all you can say this morning.  Equity markets are reeling after a slew of disappointing economic reports this morning.  The 10-year is trading at 1.46%. MBS are trading higher as well. The German 2-year bund actually has a negative yield.

The unemployment rate ticked up to 8.2% and the economy added just 69,000 jobs last month. The labor force participation rate rose to 63.8%, reversing April's decline. The average workweek declined, which bodes ill for future hiring.

With the massive rally in the 10-year, you would think Operation Twist would be put on the back burner. You would be wrong. Federal Reserve Bank of Boston head Eric Rosengren is advocating continuing Operation Twist (where the Fed buys long-dated bonds and sells short-dated paper in an attempt to lower long-term rates). Given the massive rally we have experienced in the 10 year, May's jobs report should have been great. Anyone think June's report is going to be great?

Facebook's IPO is instructive in that it shows how the relationship between issuer and bank has become more important than the relationship between investor and investment bank. Many moons ago, when I was in business school, we used to ask why IPOs popped so much on day 1. A pop in the stock meant that issuers were leaving money on the table. One explanation was that while an investment bank would get a deal from an issuer maybe once every few years, they had to deal with their buy-side clients every day. So they were more interested in keeping Fidelity happy than they were in keeping XYZ.com happy. Which meant IPOs were usually under-priced.

Fast forward to today:  Facebook was a disaster if you were an investor. But the investor's loss was Facebook's gain. The banks managed to sell as many shares as possible at as high a price as possible. What has changed?  IMO commissions and spreads. When I started in the business, institutions paid a nickle a share to trade a stock. Bid/Ask spreads were 1/8. Sales and trading was a lucrative business that was conducted over the phone.  Nowadays, you can trade inside the penny spread, and commissions are 1/4 of a cent a share. Everything is automated. Sales and trading is a loss-leader business, which means banks are more interested in keeping issuers happy than they are keeping investors happy. If Fidelity is mad, who cares?  Morgan Stanley isn't making anything from them anyway...